|
2.4.2. Carbon Dioxide Emissions Histograms
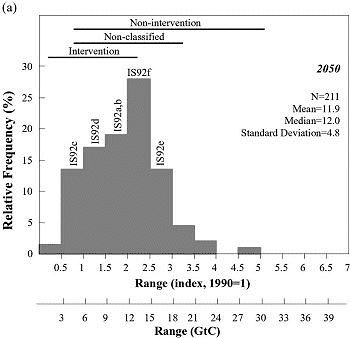
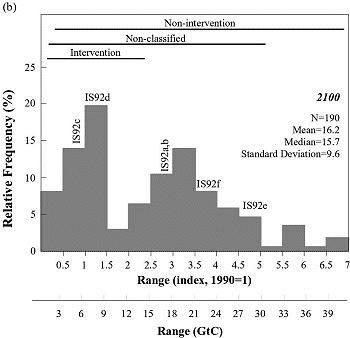
The first two histograms (Figures 2-2a and 2-2b)
give the global CO2 emissions ranges for 2050 and 2100. 7
The total range from the highest to the lowest scenario in 2100 is between 59
and 2 GtC,8
from about seven times the current emissions to below zero. For about 10% of
the scenarios, emissions in the year 2100 are half the current emissions or
below this level. Presumably, some of the scenarios that have low future emissions
include some policy interventions to reduce GHG emissions.
The distribution of emissions in 2050 is asymmetric; most of the scenarios
cluster in the range between 20 to 6 GtC. The thin tail that extends above this
emissions level includes only 46 of a total of 211 scenarios. Altogether, the
distribution implies a substantial increase in global CO2 emissions during the
next 50 years.
The distribution of emissions in 2100 is even more asymmetric than that in
2050. The emissions portray a structure that resembles a trimodal distribution:
those that show emissions of more than 30 GtC (20 scenarios), those with emissions
between 12 and 30 GtC (88 scenarios), and those that show emissions of less
than 12 GtC (82 scenarios). That this is quite similar to the structure of primary
energy consumption distribution for 2100 is not by chance. The lowest cluster
may have been influenced by many analyses of stabilization of atmospheric concentrations
at levels of 450-550 parts per million (106) by volume (ppmv). The
middle cluster appears to echo the many analyses that took IS92a as a reference
scenario; it indicates the possible influence of IS92 scenarios on other scenarios
in the literature. It is very likely that the majority of the scenarios in the
middle cluster foresee a substantial contribution of fossil energy sources to
total energy consumption in the year 2100; thus, in the first approximation,
CO2 emissions can be expected to be proportional to energy consumption. The
median is 15.7 GtC, surrounded by the centers of the other two modes, the first
at about 21 GtC and the second at about 9 GtC.
Published energy-related emissions vary by a factor of 17 between the highest
and lowest scenarios for 2050 and from -2 to 60 GtC between the highest and
lowest scenarios for 2100.

|
Figure 2-2a: Histogram showing the frequency
distribution of global CO2 emissions in 2050 for 211 scenarios. The first
horizontal axis shows indexed emissions (1990 = 1); the second axis indicates
approximately absolute values by multiplying the index by the 1990 value
(5.9 GtC, see footnote 4). For reference, the emissions of the IS92 scenarios
are indicated. The horizontal bars indicate the ranges for the intervention,
non-intervention, and non- classified scenario samples, respectively. The
frequency distribution associated with scenarios from the literature does
not imply probability of occurrence. |
|

|
Figure 2-2b: Histogram showing
the frequency distribution of global CO2 emissions in 2100 for 190
scenarios. The first horizontal axis shows indexed emissions (1990 =
1); the second axis indicates approximate absolute values by multiplying
the index by the 1990 value (5.9 GtC, see footnote 4). For reference,
the emissions of the IS92 scenarios are indicated. The horizontal bars
indicate the ranges for the intervention, non-intervention and non-classified
scenario samples respectively. The frequency distribution associated
with scenarios from the literature does not imply probability of occurrence. |
|