 |
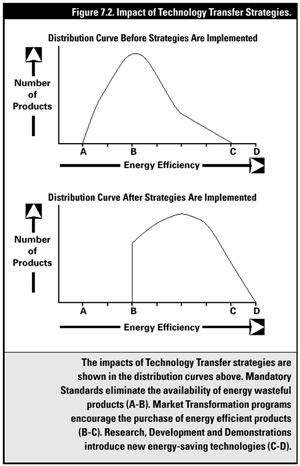
| Figure 7.2: Impact of Technology Transfer Strategies. |
7.4 Technology Transfer Strategies
The strategies for accelerating the transfer of ESTs are illustrated in Figure
7.2. The top curve shows the distribution curve of the efficiency of products
acquired by consumers prior to the start of a technology transfer programme.
The curve could be applied to any product that uses energy or produces GHG emissions,
such as furnaces, cookstoves, or housing. The slope on the right side of the
curve shows the slow penetration of more efficient technologies.
The bottom curve in Figure 7.2 shows the combined
effect of a successful technology transfer program. Building codes and appliance
standards eliminate the sale of energy-wasteful products on the left side of
the curve. RD&D introduces advanced technologies on the right side of the
curve. Market transformation strategies encourage consumers to select more ESTs.
Working together, they can produce major changes.
International interests are playing an increasingly important role both in
government-driven and private sector-driven technology transfer. The recognition
of a common global interest in reducing GHG emissions has become a powerful
additional motive for international programmes. The growing role of multinational
corporations has led to an increasing global market for new goods and services.
For each of the national technology transfer pathways, described above, there
are parallel international pathways.
|