| 5.16 |
The location of a threshold, and the
resistance to change in its vicinity, can be affected by the rate at which
the threshold is approached. Model results indicate that a threshold
may exist in the ocean thermohaline circulation (see Question
4) such that a transition to a new ocean circulation, as occurred during
the emergence from the last glacial period, could be induced if the world
warms rapidly. While such a transition is very unlikely during the 21st
century, some models suggest that it would be irreversible (i.e., the new
circulation would persist even after the perturbation disappeared). For
slower rates of warming, THC would likely gradually adjust and thresholds
may not be crossed. This implies that the greenhouse gas emission trajectory
is important in determining the evolution of THC. When a system approaches
a threshold, as is the case for a weakening THC under global warming, resilience
to perturbations decreases.
|
 WGI TAR Sections 2.4.3, 7.3.7,
& 9.3.4.3, & WGII
TAR Section 1.4.3.5
WGI TAR Sections 2.4.3, 7.3.7,
& 9.3.4.3, & WGII
TAR Section 1.4.3.5 |
| 5.17 |
Higher rates of warming and the compounded
effects of multiple stresses increase the likelihood of a threshold crossing.
An example of an ecological threshold is provided by the migration
of plant species as they respond to a changing climate. Fossil records indicate
that the maximum rate at which most plant species have migrated in the past
is about 1 km per year. Known constraints imposed by the dispersal process
(e.g., the mean period between germination and the production of seeds,
and the mean distance that an individual seed can travel) suggest that,
without human intervention, many species would not be able to keep up with
the rate of movement of their preferred climatic niche projected for the
21st century, even if there were no barriers to their movement imposed by
land use. An example of a socio-economic threshold is provided by conflicts
in already stressed situations -- for example, a river basin shared by
several nations with competition for a limited water resource. Further pressure
from an environmental stress such as reduced stream flow could trigger more
severe conflict. If impacted systems are not fully understood, the presence
of a threshold may not be apparent until it is reached.
|
WGII TAR Sections 1.2.1.2,
4.7.3, & 5.2,
WGIII TAR TS 2.3, SRES
Box 4.2, & WGII SAR A.4.1 |
| |
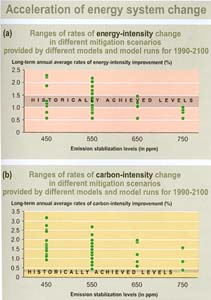
Figure 5-7:(a)The required
rate of decrease in energy intensity (energy per unit GDP) in order to meet
given CO2 concentration stabilization targets is within the range
of historically achieved rates for stabilization above 550 ppm, and possibly
even at 450 ppm, but (b) the required rate of improvement in carbon intensity
(carbon emissions per unit energy) to stabilize at levels below about 600
ppm is higher than the historically achieved rates.As a consequence,
the cost of mitigation rises as the stabilization level decreases, and does
so more steeply below a target of about 600 ppm than above (see Figure
7-3). |
WGIII TAR Figures
2.8 & 2.18
|
|
|