| |
| |
Bottom-up studies indicate that substantial low-cost
mitigation opportunities exist. According to bottom-up assessments
(see Box 7-1) of specific
technologies and sectors, half of the potential emissions reductions
noted in Table 7-1 may be
achieved by the year 2020 with direct benefits exceeding direct costs,
and the other half at a net direct cost of up to US$100 per t Ceq
(at 1998 prices). However, for reasons described below, the realized
potential may be different. These cost estimates are derived using discount
rates in the range of 5 to 12%, consistent with public-sector discount
rates. Private internal rates of return vary greatly, and are often
significantly higher, affecting the rate of adoption of these technologies
by private entities. Depending on the emissions scenario, this could
allow global emissions to be reduced below year 2000 levels in the period
2010-2020 at these net direct costs. Realizing these reductions
involves additional implementation costs, which in some cases may be
substantial, the possible need for supporting policies, increased R&D,
effective technology transfer, and overcoming other barriers. The various
global, regional, national, sector, and project studies assessed in
the WGIII TAR have different scopes and assumptions. Studies do not
exist for every sector and region.
|
 WGIII TAR Sections 1.5, 3.3-8,
5.3-4, & 6.2
WGIII TAR Sections 1.5, 3.3-8,
5.3-4, & 6.2 |
| 7.16 |
Cost
estimates using bottom-up analyses reported to date for biological mitigation
vary significantly and do not consistently account for all significant
components of cost. Cost estimates using bottom-up analyses reported
to date for biological mitigation vary significantly from US$0.1 to about
US$20 per t C in several tropical countries and from US$20 to US$100 per
t C in non-tropical countries. Methods of financial analyses and carbon
accounting have not been comparable. Moreover, the cost calculations do
not cover, in many instances, inter alia, costs for infrastructure, appropriate
discounting, monitoring, data collection and implementation costs, opportunity
costs of land and maintenance, or other recurring costs, which are often
excluded or overlooked. The lower end of the range is assessed to be biased
downwards, but understanding and treatment of costs is improving over
time. Biological mitigation options may reduce or increase non-CO2
greenhouse gas emissions.
|
WGIII
TAR Sections 4.3-4 |
| 7.17 |
Projections of abatement cost of near-term
policy options implemented without Annex B emissions trade for meeting
a given near-term CO2 emissions target as reported by several
models15
of the global economy (top-down models) vary within regions (as shown
by the brown lines in Figure 7-2a
for Annex II regions and in Table
7-3a). Reasons for the differentiation
among models within regions is due to varying assumptions about future
GDP growth rates and changes in carbon and energy intensity (different
socio-economic development paths). The same reasons also apply to differences
across regions. These models assume that national policy instruments are
efficient and consistent with international policy instruments. That is,
they assume that reductions are made through the use of market mechanisms
(e.g., cap and trade) within each region. To the extent that regions employ
a mix of market mechanisms and command and control policies, costs will
likely be higher. On the other hand, inclusion of carbon sinks, non-CO 2
greenhouse gases, induced technical change, ancillary benefits, or targeted
revenue recycling could reduce costs.
|
WGIII
TAR Sections 8.2-3 |
| 7.18 |
The models used in the above study show that the
Kyoto mechanisms are important in controlling risks of high costs in
given countries, and thus could complement domestic policy mechanisms,
and could minimize risks of inequitable international impacts.
For example, the brown and blue lines in Figure
7-2b and Table 7-3b
show that the national marginal costs to meet the Kyoto targets range
from about US$20 up to US$600 per t C without Annex B trading, and range
from about US$15 up to US$150 per t C with Annex B trading, respectively.
At the time of these studies, most models did not include sinks, non-CO2
greenhouse gases, CDM, negative cost options, ancillary benefits, or
targeted revenue recycling, which will reduce estimated costs. On the
other hand, these models make assumptions which underestimate costs
because they assume full use of emissions trading without transaction
costs, both within and among Annex B countries, and that mitigation
responses would be perfectly efficient and that economies begin to adjust
to the need to meet Kyoto targets between the years 1990 and 2000. The
cost reductions from Annex B trading will depend on the details of implementation,
including the compatibility of domestic and international mechanisms,
constraints, and transaction costs. The following is indicative of the
broad variation in the change in GDP reported for Annex B countries:
-
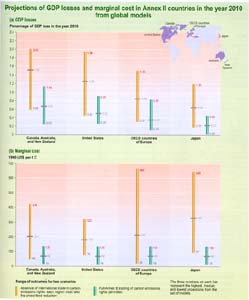
For Annex II countries, the above modeling studies
show reductions in GDP, compared to projected levels in the year 2010.
Figure 7-2 indicates that in
the absence of Annex B trading losses range from 0.2 to 2% of GDP.
With Annex B trading, losses range from 0.1 to 1% of GDP. National
studies, which explore a more diverse set of policy packages and take
account of specific national circumstances, vary even more widely.
-
For most economies in transition, GDP effects range
from negligible to a several percent increase, reflecting opportunities
for energy-efficiency improvements not available to Annex II countries.
Under assumptions of drastic energy-efficiency improvement and/or
continuing economic recessions in some countries, the assigned amounts
may exceed projected emissions in the first commitment period. In
this case, models show increased GDP due to revenues from trading
assigned amounts. However, for some economies in transition, implementing
the Kyoto Protocol will have similar impact on GDP as for Annex II
countries.
|
WGIII TAR Sections TS 8.3,
7.3, 8.3,
9.2, & 10.2 |
| |
Figure 7-2: Projections
of GDP losses and marginal costs in Annex II countries in the year 2010
from global models: (a) GDP losses and (b) marginal costs. The reductions
in projected GDP are for the year 2010 relative to the model reference
case GDP. These estimates are based on results of an Energy Modeling Forum
study. The projections reported in the figures are for four regions, which
constitute Annex II. The models examined two scenarios. In the first,
each region makes the prescribed reduction with only domestic trading
in carbon emissions. In the second, Annex B trading is permitted and thereby
marginal costs are equal across regions. For the key factors, assumptions,
and uncertainties underlying the studies, see Box
7-1. |
WGIII TAR Sections 8.3.1 &
10.4.4 |
|
|