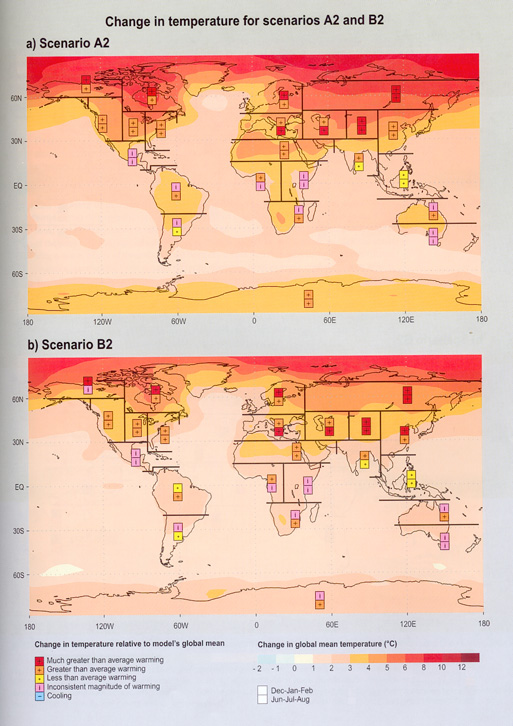
Figure 3-2: The background
shows the annual mean change of temperature (color shading) for (a) the SRES
scenario A2 and (b) the SRES scenario B2. Both SRES scenarios show the
period 2071 to 2100 relative to the period 1961 to 1990, and were performed by
AOGCMs. Scenarios A2 and B2 are shown as no AOGCM runs were available for the
other SRES scenarios. The boxes show an analysis of inter-model consistency in
regional relative warming (i.e., warming relative to each model's global
average warming) for the same scenarios. Regions are classified as showing either
agreement on warming in excess of 40% above the global mean annual average (much
greater than average warming), agreement on warming greater than the global mean
annual average (greater than average warming), agreement on warming less than
the global mean annual average (less than average warming), or disagreement amongst
models on the magnitude of regional relative warming (inconsistent magnitude of
warming). There is also a category for agreement on cooling (this category never
occurs). A consistent result from at least seven of the nine models is defined
as being necessary for agreement. The global mean annual average warming of the
models used span 1.2 to 4.5°C for A2 and 0.9 tO3.4°C for B2,
and therefore a regional 40% amplification represents warming ranges of 1.7 to
6.3°C for A2 and 1.3 to 4.7°C for B2.