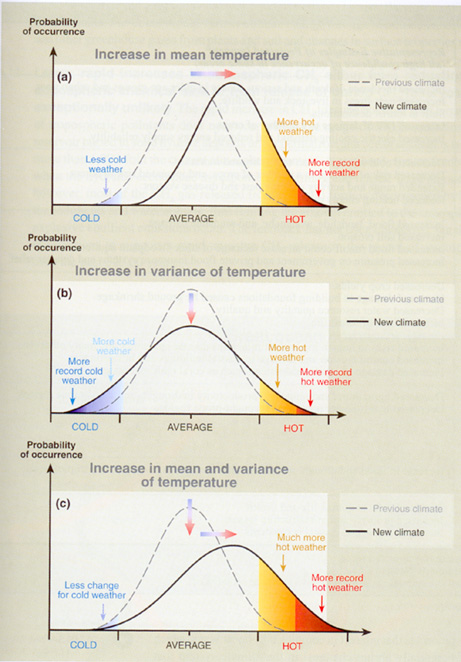
Figure 4-1: Schematic diagrams
showing the effects on extreme temperatures when (a) the mean increases,
leading to more record hot weather, (b) the variance increases, and (c) when both
the mean and variance increase, leading to much more record hot weather.