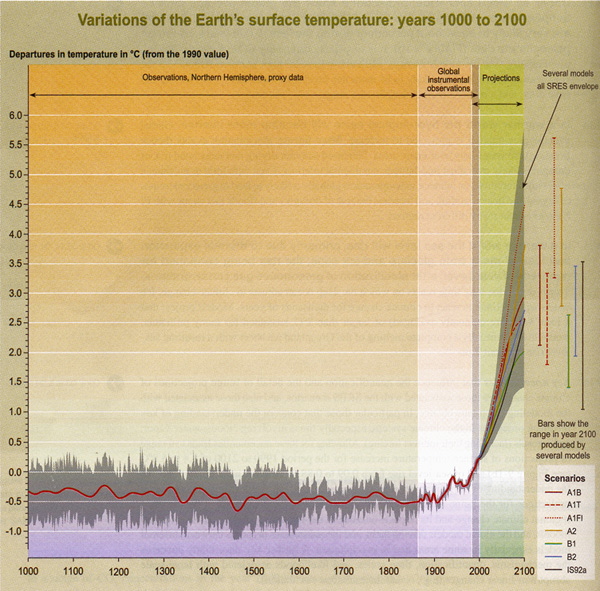
Figure 9-1b: Variations of the
Earth's surface temperature: years 1000 to 2100. Over the period 1000
to 1860, observations are shown of variations in average surface temperature of
the Northern Hemisphere (corresponding data from the Southern Hemisphere not available)
constructed from proxy data (tree rings, corals, ice cores, and historical records).
The line shows the 50-year average, and the grey region the 95% confidence limit
in the annual data. From the years 1860 to 2000, observations are shown of variations
of global and annual averaged surface temperature from the instrumental record.
The line shows the decadal average. Over the period 2000 to 2100, projections
are shown of globally averaged surface temperature for the six illustrative SRES
scenarios and IS92a as estimated by a model with average climate sensitivity.
The grey region "several models all SRES envelope" shows the range of
results from the full range of 35 SRES scenarios in addition to those from a range
of models with different climate sensitivities.