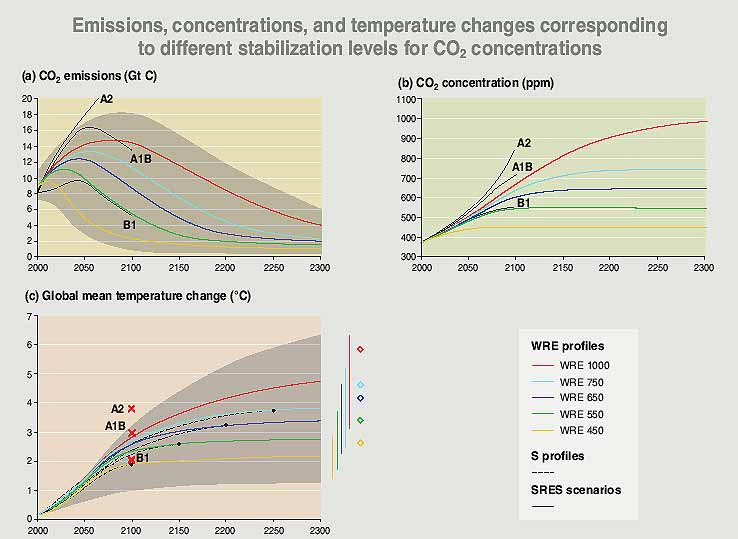
Figure SPM-6: Stabilizing CO2 concentrations would require
substantial reductions of emissions below current levels and would slow the
rate of warming.
- CO2 emissions: The time paths of CO2 emissions that
would lead to stabilization of the concentration of CO2 in the
atmosphere at various levels are estimated for the WRE stabilization profiles
using carbon cycle models. The shaded area illustrates the range of uncertainty.
- CO2 concentrations: The CO2 concentrations specified
for the WRE profiles are shown.
- Global mean temperature changes: Temperature changes are estimated using
a simple climate model for the WRE stabilization profiles.Warming continues
after the time at which the CO2 concentration is stabilized (indicated
by black spots), but at a much diminished rate. It is assumed that emissions
of gases other than CO2 follow the SRES A1B projection until the
year 2100 and are constant thereafter. This scenario was chosen as it is in
the middle of the range of SRES scenarios. The dashed lines show the temperature
changes projected for the S profiles (not shown in panels (a) or (b)).The
shaded area illustrates the effect of a range of climate sensitivity across
the five stabilization cases. The colored bars on the righthand side show
uncertainty for each stabilization case at the year 2300. The diamonds on
the righthand side show the average equilibrium (very long-term) warming for
each CO2 stabilization level.Also shown for comparison are CO2
emissions, concentrations, and temperature changes for three of the SRES scenarios.
Back to text