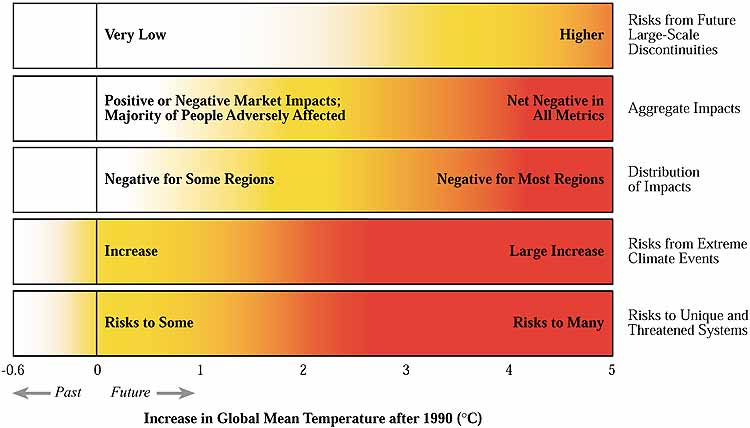
Figure TS-12: Impacts of
or risks from climate change, by reason for concern. Each row corresponds to a
reason for concern, and shades correspond to severity of impact or risk. White
means no or virtually neutral impact or risk, yellow means somewhat negative impacts
or low risks, and red means more negative impacts or higher risks. Global-averaged
temperatures in the 20th century increased by 0.6°C and led to some impacts.
Impacts are plotted against increases in global mean temperature after 1990. This
figure addresses only how impacts or risks change as thresholds of increase in
global mean temperature are crossed, not how impacts or risks change at different
rates of change in climate. These temperatures should be taken as approximate
indications of impacts, not as absolute thresholds.