B.5 Observed Changes in Atmospheric and Oceanic Circulation Patterns
The behaviour of ENSO (see Box 4 for a general description),
has been unusual since the mid-1970s compared with the previous 100 years, with
warm phase ENSO episodes being relatively more frequent, persistent, and intense
than the opposite cool phase. This recent behaviour of ENSO is reflected in
variations in precipitation and temperature over much of the global tropics and
sub-tropics. The overall effect is likely to have been a small contribution to
the increase in global temperatures during the last few decades. The Inter-decadal
Pacific Oscillation and the Pacific Decadal Oscillation are associated with decadal
to multidecadal climate variability over the Pacific basin. It is likely that
these oscillations modulate ENSO-related climate variability.
Other important circulation features that affect the climate in large regions
of the globe are being characterised. The North Atlantic Oscillation (NAO)
is linked to the strength of the westerlies over the Atlantic and extra-tropical
Eurasia. During winter the NAO displays irregular oscillations on interannual
to multi-decadal time-scales. Since the 1970s, the winter NAO has often been
in a phase that contributes to stronger westerlies, which correlate with cold
season warming over Eurasia. New evidence indicates that the NAO and changes
in Arctic sea ice are likely to be closely coupled. The NAO is now believed
to be part of a wider scale atmospheric Arctic Oscillation that affects much
of the extratropical Northern Hemisphere. A similar Antarctic Oscillation has
been in an enhanced positive phase during the last 15 years, with stronger westerlies
over the Southern Oceans.
B.6 Observed Changes in Climate Variability and Extreme Weather and Climate
Events
New analyses show that in regions where total precipitation has increased,
it is very likely that there have been even more pronounced increases in heavy
and extreme precipitation events. The converse is also true. In some regions,
however, heavy and extreme events (i.e., defined to be within the upper or lower
ten percentiles) have increased despite the fact that total precipitation has
decreased or remained constant. This is attributed to a decrease in the frequency
of precipitation events. Overall, it is likely that for many mid- and high latitude
areas, primarily in the Northern Hemisphere, statistically significant increases
have occurred in the proportion of total annual precipitation derived from heavy
and extreme precipitation events; it is likely that there has been a 2 to 4% increase
in the frequency of heavy precipitation events over the latter half of the 20th
century. Over the 20th century (1900 to 1995), there were relatively small increases
in global land areas experiencing severe drought or severe wetness. In some regions,
such as parts of Asia and Africa, the frequency and intensity of drought have
been observed to increase in recent decades. In many regions, these changes are
dominated by inter-decadal and multi-decadal climate variability, such as the
shift in ENSO towards more warm events. In many regions, inter-daily temperature
variability has decreased, and increases in the daily minimum temperature are
lengthening the freeze-free period in most mid- and high latitude regions. Since
1950 it is very likely that there has been a significant reduction in the frequency
of much-below-normal seasonal mean temperatures across much of the globe, but
there has been a smaller increase in the frequency of much-above-normal seasonal
temperatures.
There is no compelling evidence to indicate that the characteristics of
tropical and extratropical storms have changed. Changes in tropical storm
intensity and frequency are dominated by interdecadal to multidecadal variations,
which may be substantial, e.g., in the tropical North Atlantic. Owing to incomplete
data and limited and conflicting analyses, it is uncertain as to whether there
have been any long-term and large-scale increases in the intensity and frequency
of extra-tropical cyclones in the Northern Hemisphere. Regional increases have
been identified in the North Pacific, parts of North America, and Europe over
the past several decades. In the Southern Hemisphere, fewer analyses have been
completed, but they suggest a decrease in extra-tropical cyclone activity since
the 1970s. Recent analyses of changes in severe local weather (e.g., tornadoes,
thunderstorm days, and hail) in a few selected regions do not provide compelling
evidence to suggest long-term changes. In general, trends in severe weather
events are notoriously difficult to detect because of their relatively rare
occurrence and large spatial variability.
B.7 The Collective Picture: A Warming World and Other Changes in the Climate
System
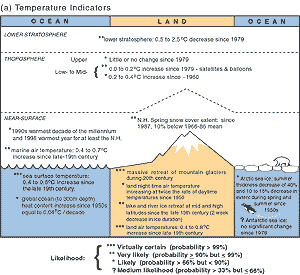
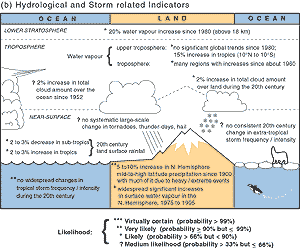
As summarised above, a suite of climate changes is now well-documented, particularly
over the recent decades to century time period, with its growing set of direct
measurements. Figure 7 illustrates these trends in
temperature indicators (Figure 7a) and hydrological
and storm-related indicators (Figure 7b), as well
as also providing an indication of certainty about the changes.

Figure 7a: Schematic of observed variations of the temperature indicators.
[Based on Figure 2.39a] |

Figure 7b: Schematic of observed variations of the hydrological and
storm-related indicators. [Based on Figure 2.39b] |
Taken together, these trends illustrate a collective picture of a warming
world:
- Surface temperature measurements over the land and oceans (with two separate
estimates over the latter) have been measured and adjusted independently.
All data sets show quite similar upward trends globally, with two major warming
periods globally: 1910 to 1945 and since 1976. There is an emerging tendency
for global land-surface air temperatures to warm faster than the global ocean-surface
temperatures.
- Weather balloon measurements show that lower-tropospheric temperatures have
been increasing since 1958, though only slightly since 1979. Since 1979, satellite
data are available and show similar trends to balloon data.
- The decrease in the continental diurnal temperature range coincides with
increases in cloud amount, precipitation, and increases in total water vapour.
- The nearly worldwide decrease in mountain glacier extent and ice mass is
consistent with worldwide surface temperature increases. A few recent exceptions
in coastal regions are consistent with atmospheric circulation variations
and related precipitation increases.
- The decreases in snow cover and the shortening seasons of lake and river
ice relate well to increases in Northern Hemispheric land-surface temperatures.
- The systematic decrease in spring and summer sea-ice extent and thickness
in the Arctic is consistent with increases in temperature over most of the
adjacent land and ocean.
- Ocean heat content has increased, and global average sea level has risen.
- The increases in total tropospheric water vapour in the last 25 years are
qualitatively consistent with increases in tropospheric temperatures and an
enhanced hydrologic cycle, resulting in more extreme and heavier precipitation
events in many areas with increasing precipitation, e.g., middle and high
latitudes of the Northern Hemisphere.
Some important aspects of climate appear not to have changed.
- A few areas of the globe have not warmed in recent decades, mainly over
some parts of the Southern Hemisphere oceans and parts of Antarctica.
- No significant trends in Antarctic sea-ice extent are apparent over the
period of systematic satellite measurements (since 1978).
- Based on limited data, the observed variations in the intensity and frequency
of tropical and extra-tropical cyclones and severe local storms show no clear
trends in the last half of the 20th century, although multi-decadal fluctuations
are sometimes apparent.
The variations and trends in the examined indicators imply that it is virtually
certain that there has been a generally increasing trend in global surface temperature
over the 20th century, although short-term and regional deviations from this trend
occur.
|