|
E.4 New Estimates of Responses to Natural Forcing
Assessments based on physical principles and model simulations indicate
that natural forcing alone is unlikely to explain the recent observed global
warming or the observed changes in vertical temperature structure of the atmosphere.
Fully coupled ocean-atmosphere models have used reconstructions of solar and
volcanic forcings over the last one to three centuries to estimate the contribution
of natural forcing to climate variability and change. Although the reconstruction
of natural forcings is uncertain, including their effects produces an increase
in variance at longer (multi-decadal) time-scales. This brings the low-frequency
variability closer to that deduced from palaeo-reconstructions. It is likely
that the net natural forcing (i.e., solar plus volcanic) has been negative over
the past two decades, and possibly even the past four decades. Statistical assessments
confirm that simulated natural variability, both internal and naturally forced,
is unlikely to explain the warming in the latter half of the 20th century (see
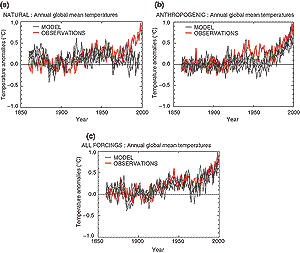
Figure 15). However, there is evidence for a detectable
volcanic influence on climate and evidence that suggests a detectable solar
influence, especially in the early part of the 20th century. Even if the models
underestimate the magnitude of the response to solar or volcanic forcing, the
spatial and temporal patterns are such that these effects alone cannot explain
the observed temperature changes over the 20th century.
|

Figure 15: Global mean surface temperature anomalies relative
to the 1880 to 1920 mean from the instrumental record compared with ensembles
of four simulations with a coupled ocean-atmosphere climate model forced
(a) with solar and volcanic forcing only, (b) with anthropogenic
forcing including well mixed greenhouse gases, changes in stratospheric
and tropospheric ozone and the direct and indirect effects of sulphate
aerosols, and (c) with all forcings, both natural and anthropogenic.
The thick line shows the instrumental data while the thin lines show the
individual model simulations in the ensemble of four members. Note that
the data are annual mean values. The model data are only sampled at the
locations where there are observations. The changes in sulphate aerosol
are calculated interactively, and changes in tropospheric ozone were calculated
offline using a chemical transport model. Changes in cloud brightness
(the first indirect effect of sulphate aerosols) were calculated by an
off line simulation and included in the model. The changes in stratospheric
ozone were based on observations. The volcanic and solar forcing were
based on published combinations of measured and proxy data. The net anthropogenic
forcing at 1990 was 1.0 Wm-2 including a net cooling of 1.0
Wm-2 due to sulphate aerosols. The net natural forcing for
1990 relative to 1860 was 0.5 Wm-2, and for 1992 was a net
cooling of 2.0 Wm-2 due to Mount Pinatubo. Other models forced
with anthropogenic forcing give similar results to those shown in (b).
[Based on Figure 12.7]
|
E.5 Sensitivity to Estimates of Climate Change Signals
There is a wide range of evidence of qualitative consistencies between observed
climate changes and model responses to anthropogenic forcing. Models and observations
show increasing global temperature, increasing land-ocean temperature contrast,
diminishing sea-ice extent, glacial retreat, and increases in precipitation at
high latitudes in the Northern Hemisphere. Some qualitative inconsistencies remain,
including the fact that models predict a faster rate of warming in the mid- to
upper troposphere than is observed in either satellite or radiosonde tropospheric
temperature records.
All simulations with greenhouse gases and sulphate aerosols that have been
used in detection studies have found that a significant anthropogenic contribution
is required to account for surface and tropospheric trends over at least the
last 30 years. Since the SAR, more simulations with increases in greenhouse
gases and some representation of aerosol effects have become available. Several
studies have included an explicit representation of greenhouse gases (as opposed
to an equivalent increase in CO2). Some have also included tropospheric
ozone changes, an interactive sulphur cycle, an explicit radiative treatment
of the scattering of sulphate aerosols, and improved estimates of the changes
in stratospheric ozone. Overall, while detection of the climate response to
these other anthropogenic factors is often ambiguous, detection of the influence
of greenhouse gases on the surface temperature changes over the past 50 years
is robust. In some cases, ensembles of simulations have been run to reduce noise
in the estimates of the time-dependent response. Some studies have evaluated
seasonal variation of the response. Uncertainties in the estimated climate change
signals have made it difficult to attribute the observed climate change to one
specific combination of anthropogenic and natural influences, but all studies
have found a significant anthropogenic contribution is required to account for
surface and tropospheric trends over at least the last thirty years.
|