| Working Group I: The Scientific Basis |
| Working Group I: The Scientific Basis |
|
|
|
| Other reports in this collection | |
|
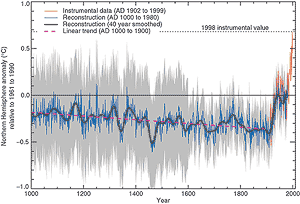
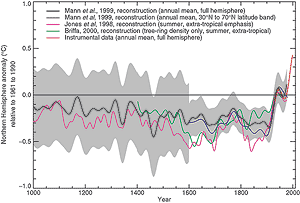
Continued from previous page Documentary evidenceHistorical documentary data are valuable sources of information about past climate (e.g., Brown and Issar, 1998; Bradley, 1999). However, their use requires great care, as such documents may be biased towards describing only the more extreme events, and are, in certain cases, prone to the use of inconsistent language between different writers and different epochs, and to errors in dating. As for all proxy information, historical documents require careful calibration and verification against modern instrumental data. Two areas particularly strong in historical documents describing climate are Europe and China. In Europe, attempts have been made to extend long climate series back in time using a combination of documentary evidence and fragmentary instrumental records (e.g., Pfister, 1995; Pfister et al., 1998). Additional information about past climate change has also been obtained purely from documentary records in Europe (e.g., Martin-Vide and Barriendos, 1995; Brázdil, 1996; Pfister et al., 1996, 1998, 1999; Pfister and Brázdil, 1999; Rodrigo et al., 1999). In China, regional instrumental temperature series have been extended back over much of the past millennium using documentary data combined with inferences from ice cores and tree rings (Wang et al., 1998a, 1998b; Wang and Gong, 2000). The position of moraines or till left behind by receding glaciers can provide information on the advances (and, less accurately, the retreats) of mountain glaciers. Owing to the complex balance between local changes in melting and ice accumulation, and the effects of topography which influence mountain glaciers (see Section 2.2.5.4), it is difficult to reconstruct regional (as opposed to global) climate changes from the extent of mountain glaciers alone (Oerlemans, 1989). For example, both increased winter precipitation (through greater accumulation) and lower summer temperatures (through decreased melting or �ablation�) can lead to more positive glacial mass balances. The inertia of large glaciers dictates that they respond to climate change relatively slowly, with delays of decades or occasionally centuries. For smaller, fast moving glaciers in regions where precipitation and accumulation are moderate, temperature changes are usually the dominant factor influencing mountain glacier masses and lengths. Here glacier moraine evidence in combination with other lines of evidence can provide reliable information on past regional temperature changes (Salinger, 1995; Holzhauser and Zumbühl, 1996; Raper et al., 1996; Salinger et al., 1996). 2.3.2.2 Multi-proxy synthesis of recent temperature changeSince the SAR there have been several attempts to combine various types of high-resolution proxy climate indicators to create large-scale palaeoclimate reconstructions that build on earlier work by e.g., Bradley and Jones (1993); Hughes and Diaz (1994) and Mann et al. (1995). Overpeck et al. (1997) and Fisher (1997) have sought to combine information from ice cores, varved lake sediment cores, and tree rings to reconstruct high latitude climate trends for past centuries. Jones et al. (1998) estimated extra-tropical Northern and Southern Hemisphere warm-season temperature changes during the past millennium using a sparse set of extra-tropical warm-season temperature proxy indicators (10 and 8 respectively). Mann et al. (1998) reconstructed global patterns of annual surface temperature several centuries back in time. They calibrated a combined terrestrial (tree ring, ice core and historical documentary indicator) and marine (coral) multi-proxy climate network against dominant patterns of 20th century global surface temperature. Averaging the reconstructed temperature patterns over the far more data-rich Northern Hemisphere half of the global domain, they estimated the Northern Hemisphere mean temperature back to AD 1400, a reconstruction which had significant skill in independent cross-validation tests. Self-consistent estimates were also made of the uncertainties. This work has now been extended back to AD 1000 (Figure 2.20, based on Mann et al., 1999). The uncertainties (the shaded region in Figure 2.20) expand considerably in earlier centuries because of the sparse network of proxy data. Taking into account these substantial uncertainties, Mann et al. (1999) concluded that the 1990s were likely to have been the warmest decade, and 1998 the warmest year, of the past millennium for at least the Northern Hemisphere. Jones et al. (1998) came to a similar conclusion from largely independent data and an entirely independent methodology. Crowley and Lowery (2000) reached the similar conclusion that medieval temperatures were no warmer than mid-20th century temperatures. Borehole data (Pollack et al., 1998) independently support this conclusion for the past 500 years although, as discussed earlier (Section 2.3.2.1), detailed interpretations comparison with long-term trends from such of such data are perilous owing to loss of temporal resolution back in time. The largely independent multi-proxy Northern Hemisphere temperature reconstructions of Jones et al. (1998) and Mann et al. (1999) are compared in Figure 2.21, together with an independent (extra-tropical, warm-season) Northern Hemisphere temperature estimate by Briffa (2000) based on tree-ring density data. The estimated uncertainties shown are those for the smoothed Mann et al. series. Significant differences between the three reconstructions are evident during the 17th and early 19th centuries where either the Briffa et al. or Jones et al. series lie outside the estimated uncertainties in the Mann et al. series. Much of these differences appear to result from the different latitudinal and seasonal emphases of the temperature estimates. This conclusion is supported by the observation that the Mann et al. hemispheric temperature average, when restricted to just the extra-tropical (30 to 70°N band) region of the Northern Hemisphere, shows greater similarity in its trend over the past few centuries to the Jones et al. reconstruction. The differences between these reconstructions emphasise the importance of regional and seasonal variations in climate change. These are discussed in the next section. |
|
Other reports in this collection |