|
4.2.2 Montreal Protocol Gases and Stratospheric Ozone (O3)
The Montreal Protocol is an internationally accepted agreement whereby nations
agree to control the production of ozone-depleting substances. Many of the chemicals
that release chlorine atoms into the stratosphere, and deplete stratospheric
O3, are also greenhouse gases, so they are discussed briefly here.
Detailed assessment of the current observations, trends, lifetimes, and emissions
for substances covered by the protocol are in WMO (Kurylo and Rodriguez, 1999;
Prinn and Zander, 1999). The ozone-depleting gases with the largest potential
to influence climate are CFC-11 (CFCl3), CFC-12 (CF2Cl2),
and CFC-113 (CF2ClCFCl2). It is now clear from measurements
in polar firn air that there are no natural sources of these compounds (Butler
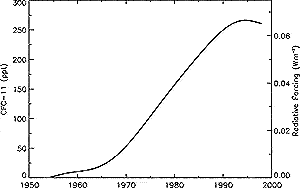
et al., 1999). Surface measurements of these compounds show that their growth
rates continue to decline. Growth rates are slightly negative for CFC-11 and
CFC-113 (Montzka et al., 1996a, 1999; Prinn et al., 2000); see Figure
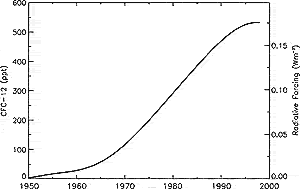
4.6. CFC-12 increased by 4 ppt/yr during 1995 to 1996, down from about 12
ppt/yr in the late 1980s, see Figure 4.7). Methyl chloroform
(CH3CCl3) has decreased dramatically since the Montreal
Protocol was invoked, due to its relatively short lifetime (about 5 years) and
the rapidity with which emissions were phased out. Its decline was 13 ppt/yr
during the period 1995 to 1996 (Prinn et al., 1998, 2000). The halon abundances
are small relative to the CFCs, and will never become large if the Montreal
Protocol is adhered to. Atmospheric measurements show that growth rates of halon-1301
and halon-2402 decreased in response to the Montreal Protocol, but halon-1211
continues to increase at rates larger than expected based on industrial emissions
data (Butler et al., 1998a; Fraser et al., 1999; Montzka et al., 1999).
The depletion of stratospheric ozone over the past three decades has been substantial.
Between 60°S and 60°N it averaged about 2%/decade. A thorough review
of the direct and possible indirect effects of stratospheric ozone depletion
are given in WMO (Granier and Shine, 1999). The depletion of O3 (and
its radiative forcing) is expected to follow the weighted halogen abundance
in the stratosphere. Therefore, both will reach a maximum in about 2000 before
starting to recover; however, detection of stratospheric O3 recovery
is not expected much before 2010 (Jackman et al., 1996; Hofmann and Pyle, 1999).
Methyl chloroform has been the main driver of the rapid turnaround in stratospheric
chlorine during the late 1990s (Montzka et al., 1999; Prinn et al., 2000), and
further recovery will rely on the more slowly declining abundances of CFC-11
and -12, and halons (Fraser et al., 1999; Montzka et al., 1999). It is expected
that stratospheric ozone depletion due to halogens will recover during the next
50 to 100 years (Hofmann and Pyle, 1999). In the short run, climatic changes,
such as cooling in the northern winter stratosphere, may enhance ozone depletion,
but over the next century, the major uncertainties in stratospheric ozone lie
with (i) the magnitude of future consumption of ozone-depleting substances by
developing countries (Fraser and Prather, 1999; Montzka et al., 1999), (ii)
the projected abundances of CH4 and N2O, and (iii) the
projected climate change impacts on stratospheric temperatures and circulation.

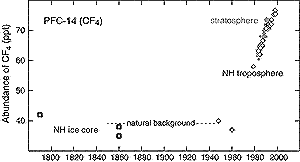
Figure 4.4: Abundance of CF4 (ppt) over the
last 200 years as measured in tropospheric air (open diamonds), stratospheric
air (small filled diamonds), and ice cores (open squares) (Harnisch
et al., 1996; 1999). |
|

Figure 4.6: Global mean CFC-11 (CFCl3 ) tropospheric abundance
(ppt) from 1950 to 1998 based on smoothed measurements and emission
models (Prinn et al., 2000). CFC-11ís radiative forcing is shown
on the right axis. |
|

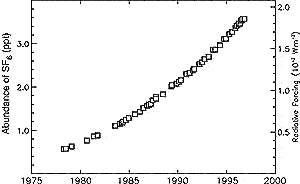
Figure 4.5: Abundance of SF6 (ppt) measured
at Cape Grim, Tasmania since 1978 (Maiss et al., 1996; Maiss and Brenninkmeijer,
1998). Cape Grim values are about 3% lower than global averages. |
|

Figure 4.7: Global mean CFC-12 (CF2Cl2
) tropospheric abundance (ppt) from 1950 to 1998 based on smoothed
measurements and emission models (Prinn et al., 2000). CFC-12ís
radiative forcing is shown on the right axis.
|
|
|