5.2.2 Primary and Secondary Sources of Aerosols
5.2.2.1 Soil dust
Soil dust is a major contributor to aerosol loading and optical thickness,
especially in sub-tropical and tropical regions. Estimates of its global source
strength range from 1,000 to 5,000 Mt/yr (Duce, 1995; see Table
5.3), with very high spatial and temporal variability. Dust source regions
are mainly deserts, dry lake beds, and semi-arid desert fringes, but also areas
in drier regions where vegetation has been reduced or soil surfaces have been
disturbed by human activities. Major dust sources are found in the desert regions
of the Northern Hemisphere, while dust emissions in the Southern Hemisphere
are relatively small. Unfortunately, this is not reflected in the source distribution
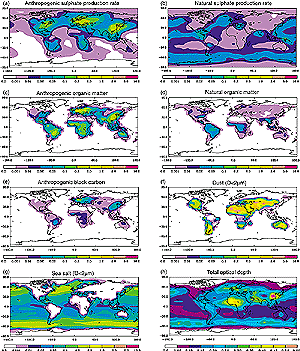
shown in Figure 5.2(f), and represents a probable shortcoming
of the dust mobilisation model used. Dust deflation occurs in a source region
when the surface wind speed exceeds a threshold velocity, which is a function
of surface roughness elements, grain size, and soil moisture. Crusting of soil
surfaces and limitation of particle availability can reduce the dust release
from a source region (Gillette, 1978). On the other hand, the disturbance of
such surfaces by human activities can strongly enhance dust mobilisation. It
has been estimated that up to 50% of the current atmospheric dust load originates
from disturbed soil surfaces, and should therefore be considered anthropogenic
in origin (Tegen and Fung, 1995), but this estimate must be considered highly
uncertain. Furthermore, dust deflation can change in response to naturally occurring
climate modes. For example, Saharan dust transport to Barbados increases during
El Niño years (Prospero and Nees, 1986), and dust export to the Mediterranean
and the North Atlantic is correlated with the North Atlantic Oscillation (Moulin
et al., 1997). Analysis of dust storm records shows regions with both increases
and decreases in dust storm frequency over the last several decades (Goudie
and Middleton, 1992).
|

Figure 5.2: Annual average source strength in kg km-2
hr-1 for each of the aerosol types considered here (a to g)
with total aerosol optical depth (h). Shown are (a) the column average
H2 SO4 production rate from anthropogenic sources,
(b) the column average H2 SO4 production rate from
natural sources (DMS and SO2 from volcanoes), (c) anthropogenic
sources of organic matter, (d) natural sources of organic matter, (e)
anthro-pogenic sources of black carbon, (f) dust ources for dust with
diameters less than 2 µm, (g) sea salt sources for sea salt with
diameters less than 2 µm, and (h) total optical depth for the sensitivity
case CHAM/GRANTOUR model (see Section 5.4.1.4).
|
| Table 5.3: Primary particle emissions for the year
2000 (Tg/yr)a. |
 |
| |
|
|
Northern
Hemisphere
|
Southern
Hemisphere
|
Global
|
Low
|
High
|
Source
|
 |
| Carbonaceous aerosols |
|
|
|
|
|
| |
Organic Matter (0-2 Ám)
|
|
|
|
|
|
| |
|
Biomass burning
|
28
|
26
|
54
|
45
|
80
|
Liousse et al. (1996),
Scholes and Andreae (2000) |
| |
|
Fossil fuel |
28
|
0.4
|
28
|
10
|
30
|
Cook et al. (1999),
Penner et al. (1993) |
| |
|
Biogenic (>1 Ám) |
-
|
-
|
56
|
0
|
90
|
Penner (1995) |
| |
Black Carbon (0-2 µm) |
|
|
|
|
|
| |
|
Biomass burning |
2.9
|
2.7
|
5.7
|
5
|
9
|
Liousse et al. (1996);
Scholes and Andreae (2000) |
| |
|
Fossil fuel |
6.5
|
0.1
|
6.6
|
6
|
8
|
Cooke et al. (1999);
Penner et al. (1993) |
| |
|
Aircraft |
0.005
|
0.0004
|
0.006
|
|
|
|
| Industrial Dust, etc. (>1 Ám) |
|
100 |
40 |
130 |
Wolf and Hidy (1997);
Andreae (1995)
Gong et al. (1998) |
| Sea Salt |
|
|
|
|
|
|
| |
|
d< 1 µm |
23
|
31
|
54
|
18
|
100
|
|
| |
|
d=1-16 µm |
1,420
|
1,870
|
3,290
|
1,000
|
6,000
|
|
| |
|
Total |
1,440
|
1,900
|
3,340
|
1,000
|
6,000
|
|
| Mineral (Soil) Dustb |
|
|
|
|
|
|
| |
|
d< 1 µm |
90
|
17
|
110
|
-
|
-
|
|
| |
|
d=1-2 µm |
240
|
50
|
290
|
-
|
-
|
|
| |
|
d=2-20 µm |
1,470
|
282
|
1,750
|
-
|
-
|
|
| |
|
Total |
1,800
|
349
|
2,150
|
1,000
|
3,000
|
|
 |
Continues on next page
|