6.5.2 Estimates of Tropospheric Ozone Radiative Forcing since Pre-Industrial
Times
6.5.2.1 Ozone radiative forcing: process studies

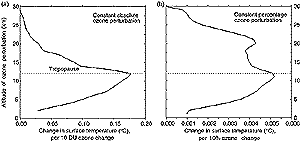
Figure 6.1: Dependence of the surface temperature response on the
height and type of O3 perturbation; (a) shows the sensitivity
to a constant absolute change (10 DU), while (b) shows the sensitivity to
a constant percentage change (10%). The model tropopause is at 12 km. From
Forster and Shine (1997). |
The dependence of surface temperature response on the height
of an imposed constant change in O3 amount (often 10 Dobson Units,
or DU) can be estimated using radiative convective models (e.g., Wang et al.,
l980; Lacis et al., l990; Forster and Shine, l997). Figure
6.1a shows the results of such a calculation. This figure suggests that
surface temperature is particularly sensitive to O3 trends near 8
to 15 km, in the vicinity of the tropopause. However, Forster and Shine (l997)
made the important point that since there is far less O3 in the troposphere
than near the tropopause and in the stratosphere, the use of a constant perturbation
is unlikely to provide a realistic measure of the sensitivity profile. For example,
10 DU corresponds to roughly a 400% increase in mid-tropospheric O3,
but much less at higher levels. Figure 6.1b shows how a
10% (rather than 10 DU) local O3 perturbation affects the calculated
surface temperature as a function of the altitude where the O3 change
is imposed (from Forster and Shine, l997). This figure suggests that the sensitivity
of surface temperature to the altitude of O3 perturbations is considerably
smaller than suggested by earlier studies that employed constant absolute changes
to probe these effects. While the study of Forster and Shine (l997) employed
a simple radiative/convective model, Hansen et al. (l997a) carried out similar
calculations using a GCM. Their study suggests that cloud feedbacks could further
lower the altitude at which surface temperature is most sensitive to O3
perturbations (Hansen et al., l997a; WMO, l999), but this work employed perturbations
of 10 DU in each layer (which is necessary to obtain a significant signal in
the GCM but is, as noted above, an unrealistically large value for the tropospheric
levels in particular).
Portmann et al. (l997) and Kiehl et al. (l999) combined an O3 climatology
based upon satellite measurements of the tropo-spheric column content (from
Fishman and Brackett, l997) with a model calculation to derive estimates of
the O3 radiative forcing for the tropics and for the globe, respectively.
They showed that the dependence of the normalised O3 forcing (Wm-2
per DU of integrated O3 column change) upon uncertainties in the
vertical distribution of the perturbation was less than previously thought,
about 0.03 to 0.06 Wm-2 per DU based upon their radiative code and
considering a range of profile shapes. This rather limited sensitivity to the
altitude distribution of the imposed perturbation is broadly consistent with
the work of Forster and Shine (l997) highlighted above and in Figure
6.1.
|