6.5.2.2 Model estimates
Table 6.3 presents a comparison of estimates of globally
averaged O3 change since pre-industrial times and its corresponding
radiative forcing based on published literature and including stratospheric
temperature adjustment. Results from several studies are presented, one constrained
by the climatology derived from observations discussed in the previous section,
and ten from global chemistry/transport models. Results are presented for both
clear sky and for total sky conditions, providing an indication of the role
of clouds, and long-wave and short-wave contributions are shown separately.
In addition, the globally averaged integrated tropospheric O3 change
(DU) is also indicated, to give a sense of the range in published model estimates
of this key factor. Finally, the normalised O3 forcings are also
presented (Wm-2 per DU).
Table 6.3: Tropospheric O3 change ( O3)
in Dobson Units (DU) since pre-industrial times, and the accompanying short-wave
(SW), long-wave (LW), and net (SW plus LW) radiative forcings (Wm-2),
after accounting for stratospheric temperature adjustment (using the Fixed
Dynamical Heating method). Estimates are taken from the published literature.
Normalised forcings (norm.) refer to radiative forcing per O3
change (Wm-2 per DU). O3)
in Dobson Units (DU) since pre-industrial times, and the accompanying short-wave
(SW), long-wave (LW), and net (SW plus LW) radiative forcings (Wm-2),
after accounting for stratospheric temperature adjustment (using the Fixed
Dynamical Heating method). Estimates are taken from the published literature.
Normalised forcings (norm.) refer to radiative forcing per O3
change (Wm-2 per DU). |
 |
| |
Clear sky conditions
|
Total sky conditions
|
| |
 |
| Reference |
 O3 O3
|
LW
|
SW
|
SW (norm.)
|
Net
|
Net (norm.)
|
LW
|
SW
|
Net
|
Net (norm.)
|
 |
| Berntsen et al. (1997) [Reading model] |
7.600
|
0.260
|
0.050
|
0.007
|
0.310
|
0.041
|
0.210
|
0.070
|
0.280
|
0.037
|
| Stevenson et al. (1998) |
8.700
|
0.326
|
0.065
|
0.007
|
0.391
|
0.045
|
0.201
|
0.088
|
0.289
|
0.033
|
| Berntsen et al. (1997) [Oslo model] |
7.600
|
0.330
|
0.060
|
0.008
|
0.390
|
0.051
|
0.230
|
0.080
|
0.310
|
0.041
|
| Haywood et al. (1998a) |
7.900
|
0.330
|
0.050
|
0.006
|
0.380
|
0.048
|
0.230
|
0.080
|
0.310
|
0.039
|
| Kiehl et al. (1999) |
8.400
|
0.316
|
0.063
|
0.008
|
0.379
|
0.045
|
0.251
|
0.069
|
0.320
|
0.038
|
| Berntsen et al. (2000) |
9.600
|
0.357
|
0.071
|
0.007
|
0.428
|
0.045
|
0.246
|
0.096
|
0.342
|
0.036
|
| Brasseur et al. (1998) |
|
|
|
|
|
|
|
|
0.370
|
|
| van Dorland et al. (1997) |
8.070
|
0.390
|
0.054
|
0.007
|
0.443
|
0.055
|
0.304
|
0.076
|
0.380
|
0.047
|
| Roelofs et al. (1997) |
7.200
|
0.350
|
0.047
|
0.007
|
0.397
|
0.055
|
0.287
|
0.117
|
0.404
|
0.056
|
| Lelieveld and Dentener (2000) |
|
|
|
|
|
|
|
|
0.420
|
|
| Hauglustaine et al. (1998) |
8.940
|
0.448
|
0.063
|
0.007
|
0.511
|
0.057
|
0.338
|
0.088
|
0.426
|
0.048
|
| Mean |
8.224
|
0.345
|
0.058
|
0.007
|
0.403
|
0.049
|
0.255
|
0.085
|
0.343
|
0.042
|
 |


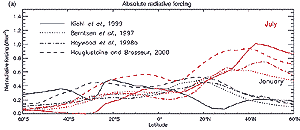
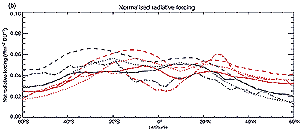
Figure 6.2: Latitudinal distribution of absolute (Wm-2)
and normalised (Wm-2 DU-1) tropospheric O3
radiative forcing for summer and winter conditions calculated by several
models. |
Table 6.3 summarises the ranges obtained
in these model studies. For total sky conditions, the range in globally and
annual averaged tropospheric O3 forcing from all of these models
is from 0.28 to 0.43 Wm-2, while the normalised forcing is 0.033
to 0.056 Wm-2 per DU. The tropospheric O3 forcing constrained
by the observational climatology is 0.32 Wm-2 for globally averaged,
total sky conditions. These estimates are comparable in magnitude (and qualitatively
similar in pattern, see Section 6.14) but opposite in
sign to that believed to be due to the direct effect of sulphate aerosols.
Figure 6.2 presents the latitudinal distributions of absolute
and normalised forcings for both January and July, from several chemistry/transport
models and from the observationally constrained evaluation. The figure shows
that the tropics and northern mid-latitude regions account for the bulk of the
global forcing. The contribution from northern mid-latitudes is particularly
large in summer, when it can reach as much as 1 Wm-2 locally near
40 to 50°N. These latitudinal gradients and seasonal changes in the zonally-averaged
forcing are likely to be reflected at least in part in patterns of response
(Hansen et al., l997a) and hence are a needed element in the detection and attribution
of climate change.
Figure 6.2 shows that the large seasonal and inter-model
ranges in absolute forcings compress somewhat when normalised forcings are considered.
At 40°N for example, the absolute forcing differs over all models and seasons
by more than a factor of 5 (Figure 6.2a), while the differences
in normalised forcings are about a factor of 2.5 (Figure 6.2b).
Mickley et al. (1999) demonstrate that the normalised forcing at extra-tropical
latitudes is largely determined by the temperature difference between the tropopause
and the Earths surface, while cloud cover plays a dominant role in the
tropics. This suggests that the differences in physical climatology between
models, and their comparison to the real atmosphere, may be a key factor in
improving understanding of the normalised forcing. The difference between the
normalised tropical and mid-latitude forcings also emphasises the need to quantify
both the O3 produced by biomass burning (and other tropical processes),
and that produced by industrial practices, especially in the northern hemisphere.
Some of the studies in Figure 6.2 suggest, for example,
that a model producing larger O3 changes in the tropics could produce
a greater globally averaged tropospheric O3 forcing than one producing
larger changes in northern mid-latitudes, even if the globally averaged O3
increases in the two studies were identical. Overall, this Figure suggests that
the differences between model estimates of tropospheric O3 forcing
since pre-industrial times are likely to be dominated by chemistry (e.g., emission
inventories, chemical processes, and transport) rather than by factors relating
to radiative transfer.
|