| Working Group I: The Scientific Basis |
| Working Group I: The Scientific Basis |
|
|
|
| Other reports in this collection | |
|
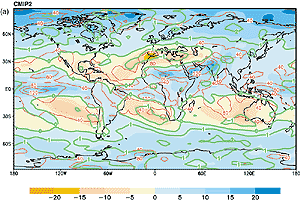
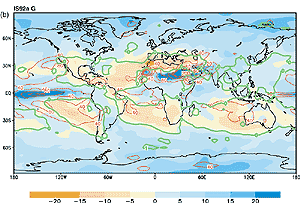
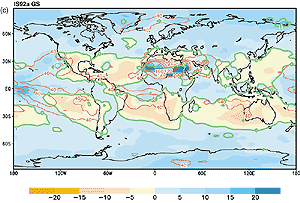
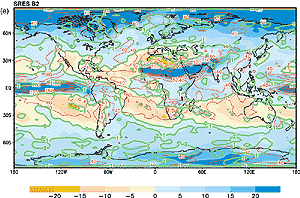
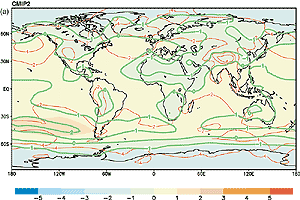
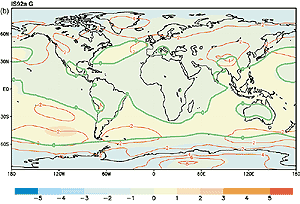
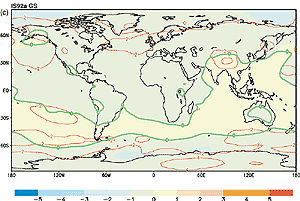
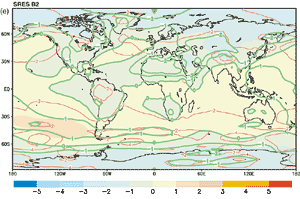
Continued from previous page The relative change in the mean precipitation (Figure 9.11) for all models in all categories shows a general increase in the tropics (particularly the tropical oceans and parts of northern Africa and south Asia) and the mid- and high latitudes, while the rainfall generally decreases in the sub-tropical belts. These changes are more evident for larger positive radiative forcing in the A2 and B2 scenario runs at the end of the 21st century (Figure 9.11d,e). This also applies to the areas of decrease that show a high inter-model variability and therefore little consistency among models, while in the tropics the change can exceed the variability of the signal by a factor of 2. This is particularly evident over the central and eastern tropical Pacific where the El Niño-like surface temperature warming is associated with an eastward shift of positive precipitation anomalies. The A2 and B2 scenario experiments exhibit a relatively large increase in precipitation over the Sahara and Arabia, but with large inter-model variability. This is partly an artefact of using percentage change rather than absolute values, since in these regions the absolute precipitation amount is very small. Other manifestations of the changes in precipitation are reported by Noda and Tokioka (1989), Murphy and Mitchell (1995) and Royer et al. (1998) who found an increase in the global mean convective rain rate in the 2xCO2 climate compared with the 1xCO2 climate. Results from another model (Brinkop, 2001; see also Cubasch et al., 1999) indicate a decrease in global mean convective precipitation. Essentially the results of Brinkop are consistent with Murphy and Mitchell, because in both transient climate simulations the strongest reduction in convective rain is found in the sub-tropics, and is most pronounced in the Southern Hemisphere. The increase in convective rain rate in the Northern Hemisphere is less strong in Brinkop compared to Murphy and Mitchell, resulting in the decrease in global mean convective rain rate. In both models the origin of the decrease in convective precipitation is an increase in stability in the troposphere in the warmer climate. In accordance with the reduction in convective precipitation, Brinkop analysed a strong decrease (11% for JJA and 7.5% for DJF) of the global mean frequency of deep convection in the warmer climate. However, the frequency of shallow convection slightly increases. The most consistent feature in the ensemble mean sea level pressure difference (Figure 9.12) is a decrease in the sea level pressure at high latitudes and an increase at mid-latitudes. In studies of the the Southern Hemisphere, this is related to a combination of changes in surface and mid-tropospheric temperature gradients (Räisänen, 1997; Fyfe et al., 1999; Kushner et al., 2001). Over wide regions of the Southern Hemisphere and Northern Hemisphere high latitudes, the ensemble mean signal generally exceeds the ensemble standard deviation indicating a consistent response across the models. For the A2 and B2 scenarios this is also found. Additionally a lowering of pressure can be found over the Sahara, probably due to thermal effects. The lowering of pressure is consistent across the A2 and B2 simulations. |
|
Other reports in this collection |