11.2.3.3 Numerical modelling
Modelling of the past history of the ice sheets and their underlying beds over
a glacial cycle is a way to obtain an estimate of the present ice-dynamic evolution
unaffected by short-term (annual to decadal) mass-balance effects. The simulation
requires time-dependent boundary conditions (surface mass balance, surface temperature,
and sea level, the latter being needed to model grounding-line changes). Current
glaciological models employ grids of 20 to 40 km horizontal spacing with 10
to 30 vertical layers and include ice shelves, basal sliding and bedrock adjustment.

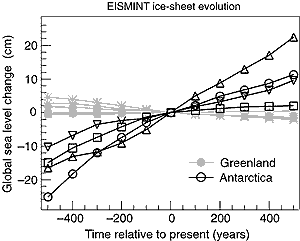
Figure 11.3: Modelled evolution of ice sheet volume (represented as
sea level equivalent) centred at the present time resulting from ongoing
adjustment to climate changes over the last glacial cycle. Data are from
all Antarctic and Greenland models that participated in the EISMINT intercomparison
exercise (From Huybrechts et al., 1998). |
Huybrechts and De Wolde (1999) and Huybrechts and Le Meur (1999) carried out
long integrations over two glacial cycles using 3-D models of Greenland and
Antarctica, with forcing derived from the Vostok (Antarctica) and Greenland
Ice Core Project (GRIP) ice cores. The retreat history of the ice sheet along
a transect in central west Greenland in particular was found to be in good agreement
with a succession of dated moraines (Van Tatenhove et al., 1995), but similar
validation elsewhere is limited by the availability of well-dated material.
Similar experiments were conducted as part of the European Ice Sheet Modelling
Initiative (EISMINT) intercomparison exercise (Huybrechts et al., 1998). These
model simulations suggest that the average Greenland contribution to global
sea level rise has been between –0.1 and 0.0 mm/yr in the last 500 years,
while the Antarctic contribution has been positive. Four different Antarctic
models yield a sea level contribution of between +0.1 and +0.5 mm/yr averaged
over the last 500 years, mainly due to incomplete grounding-line retreat of
the West Antarctic ice sheet (WAIS) since the Last Glacial Maximum (LGM) (Figure
11.3). However, substantial uncertainties remain, especially for the WAIS,
where small phase shifts in the input sea level time-series and inadequate representation
of ice-stream dynamics may have a significant effect on the model outcome. Glacio-isostatic
modelling of the solid earth beneath the Antarctic ice sheet with prescribed
ice sheet evolution (James and Ivins, 1998) gave similar uplift rates as those
presented in Huybrechts and Le Meur (1999), indicating that the underlying ice
sheet scenarios and bedrock models were similar, but observations are lacking
to validate the generated uplift rates. By contrast, Budd et al. (1998) find
that Antarctic ice volume is currently increasing at a rate of about 0.08 mm/yr
of sea level lowering because in their modelling the Antarctic ice sheet was
actually smaller during the LGM than today (for which there is, however, little
independent evidence) and the effect of the higher accumulation rates during
the Holocene dominates over the effects of grounding line changes.
Model simulations of this kind have not included the possible effects of changes
in climate during the 20th century. The simulations described later (Section
11.5.1.1), in which an ice sheet model is integrated using changes in temperature
and precipitation derived from AOGCM simulations, suggest that anthropogenic
climate change could have produced an additional contribution of between –0.2
to 0.0 mm/yr of sea level from increased accumulation in Antarctica over the
last 100 years, and between 0.0 and 0.1 mm/yr from Greenland, from both increased
accumulation and ablation. The model results for Greenland exhibit substantial
interannual variability. Furthermore, because of rising temperatures during
the 20th century, the contribution for recent decades is larger than the average
for the century. These points must be borne in mind when comparing with results
of the direct observation methods for short periods in recent decades (Sections
11.2.3.1 and 11.2.3.2). Note also that the observational
results include the ongoing response to past climate change as well as the effect
of 20th century climate change.
|