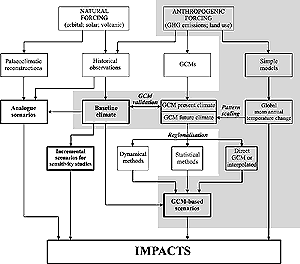
Four types of climate scenario that have been applied in impact assessments
are introduced in this section. The most common scenario type is based on outputs
from climate models and receives most attention in this chapter. The other three
types have usually been applied with reference to or in conjunction with model-based
scenarios, namely: incremental scenarios for sensitivity studies, analogue scenarios,
and a general category of “other scenarios”. The origins of these
scenarios and their mutual linkages are depicted in Figure
13.3.
The suitability of each type of scenario for use in policy-relevant impact
assessment can be assessed according to five criteria adapted from Smith and
Hulme (1998):
A summary of the major advantages and disadvantages of different scenario development
methods, based on these criteria, is presented in Table 13.1.
The relative significance of the advantages and disadvantages is highly application
dependent.
| Table 13.1: The role of various types of climate
scenarios and an evaluation of their advantages and disadvantages according
to the five criteria described in the text. Note that in some applications
a combination of methods may be used (e.g., regional modelling and a weather
generator). |
 |
| Scenario type or tool |
Description/Use |
Advantagesa |
Disadvantagesa |
|
| Incremental |
- Testing system sensitivity
- Identifying key climate threshold
|
- Easy to design and apply (5)
- Allows impact response surfaces to be created (3)
|
- Potential for creating unrealistic scenarios (1, 2)
- Not directly related to greenhouse gas forcing (1)
|
|
| Analogue: |
|
|
|
| Palaeoclimatic |
- Characterising warmer periods in past
|
- A physically plausible changed climate that really did occur in the
past of a magnitude similar to that predicted for ~2100 (2)
|
- Variables may be poorly resolved in space and time (3, 5)
- Not related to greenhouse gas forcing (1)
|
| Instrumental |
- Exploring vulnerabilities and some adaptive capacities
|
- Physically realistic changes (2)
- Can contain a rich mixture of well-resolved, internally consistent,
variables (3)
- Data readily available (5)
|
- Not necessarily related to greenhouse gas forcing (1)
- Magnitude of the climate change usually quite small (1)
- No appropriate analogues may be available (5)
|
| Spatial |
- Extrapolating climate/ecosystem relationships
- Pedagogic
|
- May contain a rich mixture of well-resolved variables (3)
|
- Not related to greenhouse gas forcing (1, 4)
- Often physically implausible (2)
- No appropriate analogues may be available (5)
|
|
| Climate model based: |
|
|
|
| Direct AOGCM outputs |
- Starting point for most climate scenarios
- Large-scale response to anthropogenic forcing
|
- Information derived from the most comprehensive, physically-based
models (1, 2)
- Long integrations (1)
- Data readily available (5)
- Many variables (potentially) available (3)
|
- Spatial information is poorly resolved (3)
- Daily characteristics may be unrealistic except for very large regions
(3)
- Computationally expensive to derive multiple scenarios (4, 5)
- Large control run biases may be a concern for use in certain regions
(2)
|
| High resolution/stretched grid (AGCM) |
- Providing high resolution information at global/continental scales
|
- Provides highly resolved information (3)
- Information is derived from physically-based models (2)
- Many variables available (3)
- Globally consistent and allows for feedbacks (1,2)
|
- Computationally expensive to derive multiple scenarios (4, 5)
- Problems in maintaining viable parametrizations across scales (1,2)
- High resolution is dependent on SSTs and sea ice margins from driving
model (AOGCM) (2)
- Dependent on (usually biased) inputs from driving AOGCM (2)
|
| Regional models |
- Providing high spatial/temporal resolution information
|
- Provides very highly resolved information (spatial and temporal) (3)
- Information is derived from physically-based models (2)
- Many variables available (3)
- Better representation of some weather extremes than in GCMs (2, 4)
|
- Computationally expensive, and thus few multiple scenarios (4, 5)
- Lack of two-way nesting may raise concern regarding completeness (2)
- Dependent on (usually biased) inputs from driving AOGCM (2)
|
| Statistical downscaling |
- Providing point/high spatial resolution information
|
- Can generate information on high resolution grids, or non-uniform
regions (3)
- Potential,for some techniques, to address a diverse range of variables
(3)
- Variables are (probably) internally consistent (2)
- Computationally (relatively) inexpensive (5)
- Suitable for locations with limited computational resources (5)
- Rapid application to multiple GCMs (4)
|
- Assumes constancy of empirical relationships in the future (1, 2)
- Demands access to daily observational surface and/or upper air data
that spans range of variability (5)
- Not many variables produced for some techniques (3, 5)
- Dependent on (usually biased) inputs from driving AOGCM (2)
|
| Climate scenario generators |
- Integrated assessments
- Exploring uncertainties
- Pedagogic
|
- May allow for sequential quantification of uncertainty (4)
- Provides ‘integrated’ scenarios (1)
- Multiple scenarios easy to derive (4)
|
- Usually rely on linear pattern scaling methods (1)
- Poor representation of temporal variability (3)
- Low spatial resolution (3)
|
|
| Weather generators |
- Generating baseline climate time-series
- Altering higher order moments of climate
- Statistical downscaling
|
- Generates long sequences of daily or sub-daily climate (2, 3)
- Variables are usually internally consistent (2)
- Can incorporate altered frequency/intensity of ENSO events (3)
|
- Poor representation of low frequency climate variability (2, 4)
- Limited representation of extremes (2, 3, 4)
- Requires access to long observational weather series (5)
- In the absence of conditioning, assumes constant statistical characteristics
(1, 2)
|
|
| Expert judgment |
- Exploring probability and risk
- Integrating current thinking on changes in climate
|
- May allow for a ‘consensus’ (4)
- Has the potential to integrate a very broad range of relevant information
(1, 3, 4)
- Uncertainties can be readily represented (4)
|
- Subjectivity may introduce bias (2)
- A representative survey of experts may be difficult to implement (5)
|
|