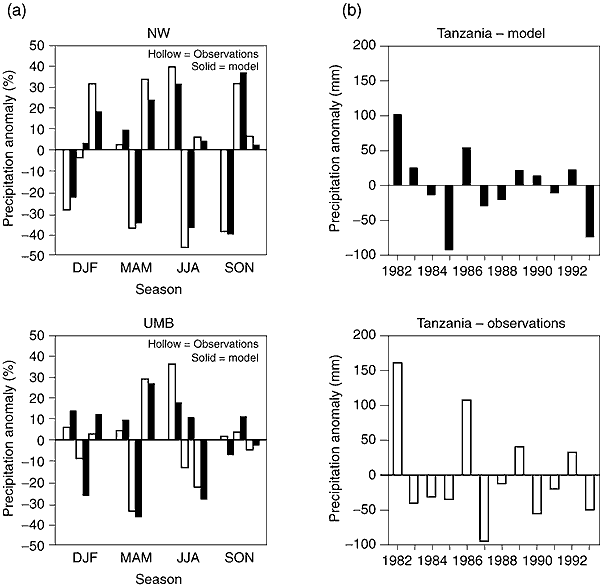
Figure 10.11: Examples of
seasonal precipitation anomalies simulated with RCMs driven by analyses of observations
over different regions. In all cases the anomalies are calculated as the difference
between the precipitation of an individual season and the average for the seasonal
value for the entire simulation. (a) (top) Northwestern USA (NW), and (bottom)
Upper Mississippi Basin (UMB) for a three year simulation (1993 to 1996) over
the continental USA. The three pairs of observed (hollow bars) and simulated (solid
bars) anomalies for each season are grouped in sequential order from 1993 to 1996.
Units are percentage of the three-year seasonal average (from Giorgi and Shields,
1999, Figure 9). (b) Precipitation anomalies for twelve short-rains periods over
Tanzania for the October-December season: (top) model simulation, and (bottom)
observations. Units are mm. (From Sun et al., 1999).