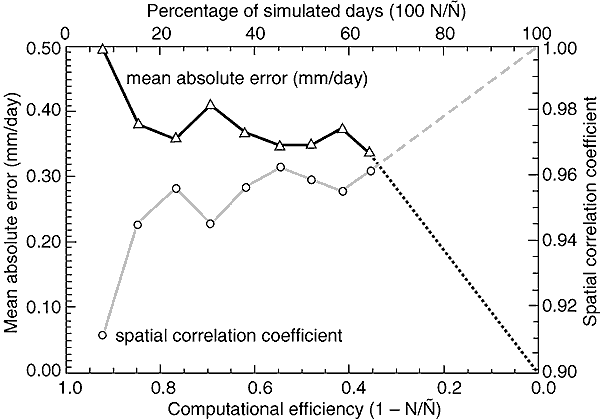
Figure 10.17: Similarity
of time mean precipitation distributions obtained in a continuous RCM simulation
and through statistical-dynamical downscaling (SDD) for different levels of disaggregation.
Black line: mean absolute error (mm/day), grey line: spatial correlation coefficient.
Horizontal axis: computational load of SDD. N is the number of days simulated
in SDD, Ñ the number of days simulated with the continuous RCM simulation.