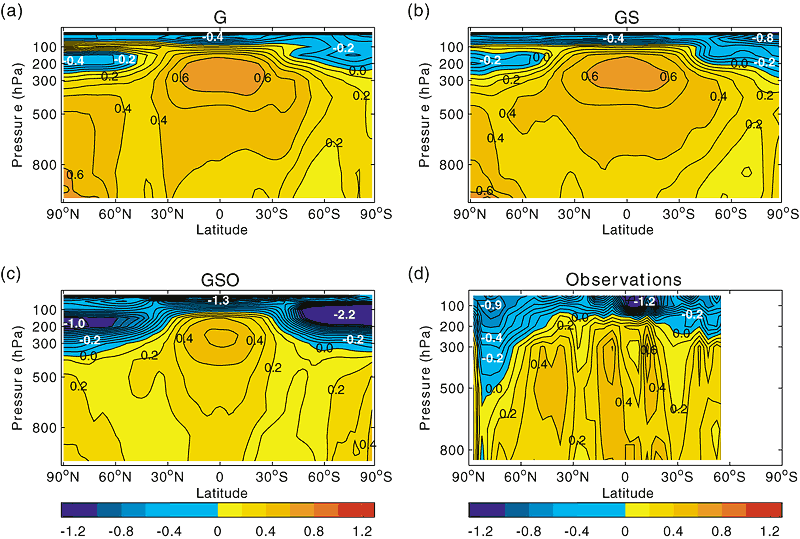
Figure 12.8: Simulated and
observed zonal mean temperature change as a function of latitude and height from
Tett et al. (1996). The contour interval is 0.1°C. All signals are defined
to be the difference between the 1986 to 1995 decadal mean and the 20 year 1961
to 1980 mean. (a), increases in CO2 only (G); (b), as (a), but with
a simple representation of sulphate aerosols added (GS); (c), as (b), with observed
changes in stratospheric ozone (GSO); (d), observed changes.