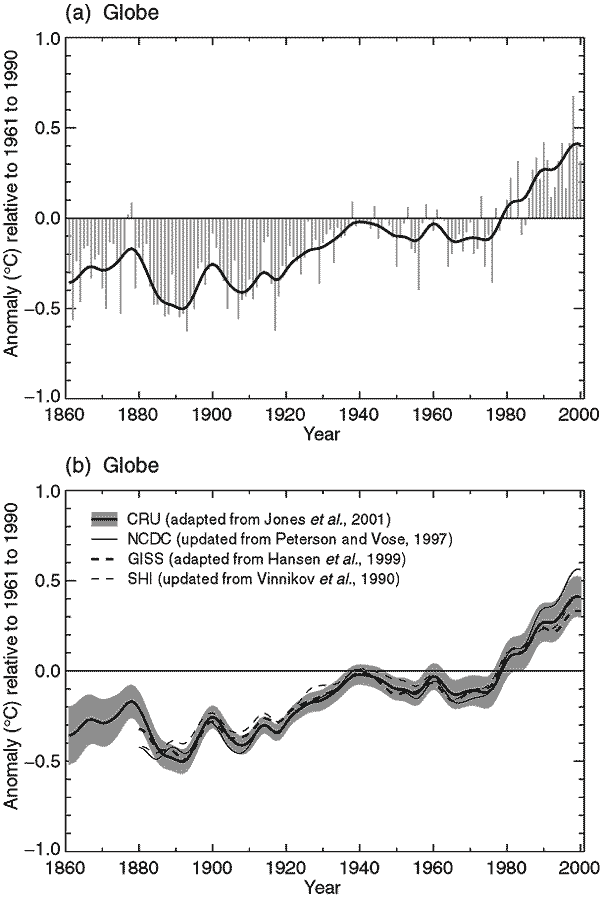
Figure 2.1: (a) Annual anomalies
of global average land-surface air temperature (°C), 1861 to 2000, relative to
1961 to 1990 values. Bars and solid curve are from CRU (Jones et al., 2001). Values
are the simple average of the anomalies for the two hemispheres. The smoothed
curve was created using a 21-point binomial filter giving near decadal averages.
(b) As (a) but smoothed curves only from NCDC (updated from Peterson and Vose,
1997) thin solid curve; GISS (adapted from Hansen et al., 1999)
thick dashed curve; SHI (updated from Vinnikov et al., 1990) thin dashed
curve to 1999 only; Peterson and Vose (1997) thin solid curve. Thick solid
curve as in (a). Two standard error uncertainties are centred on the CRU
curve and are estimated using an optimum averaging method (Folland et al., 2001)
and include uncertainties due to urbanisation but not due to uncertainties in
thermometer exposures. The NCDC curve is the weighted average of the two hemispheres
according to the area sampled, which accounts for most of the differences from
the CRU curve.