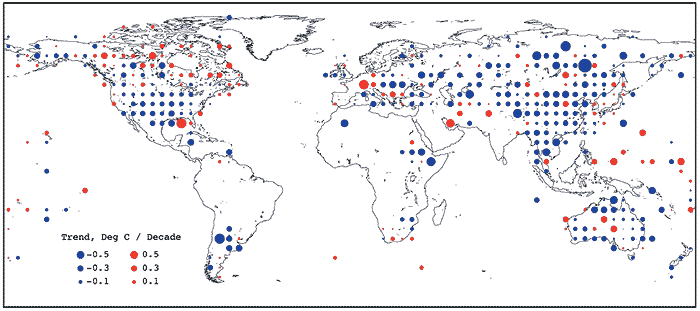
Figure. 2.2: Trends in annual
diurnal temperature range (DTR, °C/decade), from 1950 to 1993, for non-urban
stations only, updated from Easterling et al. (1997). Decreases are in blue and
increases in red. This data set of maximum and minimum temperature differs from
and has more restricted coverage than those of mean temperature used elsewhere in Section 2.2.