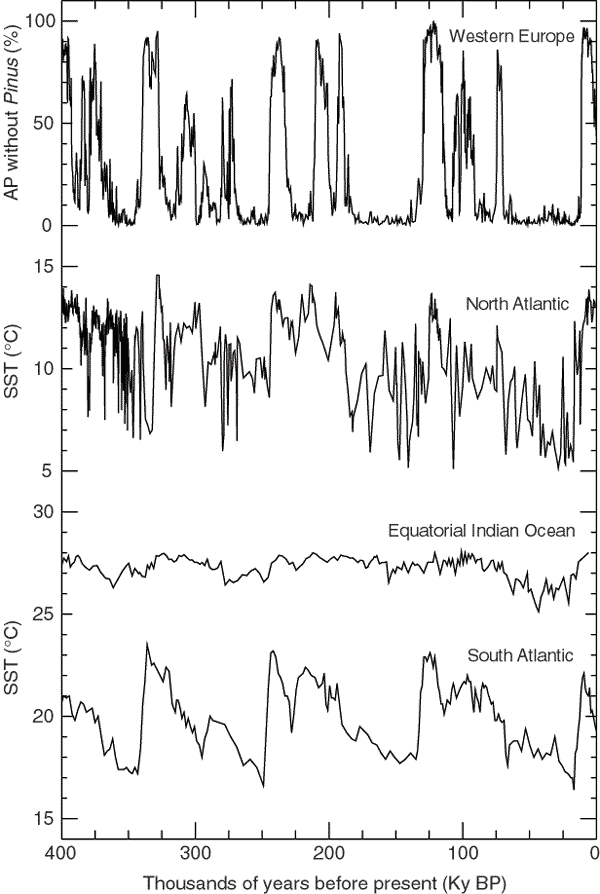
Figure 2.23: Time-series
illustrating temperature variability over the last about 400 ky (updated from
Rostek et al., 1993; Schneider et al., 1996; MacManus et al., 1999; Reille et
al., 2000). The uppermost time-series describes the percentage of tree pollen
that excludes pollen from pine tree species. The higher this percentage, the warmer
was the climate.