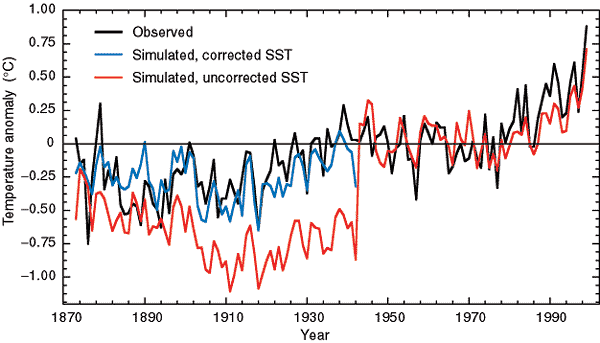
Figure 2.4: Tests of bias
adjustments to sea surface temperature (SST) using a climate model (Folland et
al., 2001). Black line - annual mean observed land surface air temperature (SAT)
anomaly (°C) from a 1946 to 1965 average (Jones, 1994), a period before major
anthropogenic warming. Red line annual averages of four simulations of
SAT anomalies using uncorrected SST data, 1872 to 1941, and an average of six
simulations for 1941 to 1998. Blue line average of six simulations of SAT,
forced with SST data corrected up to 1941.