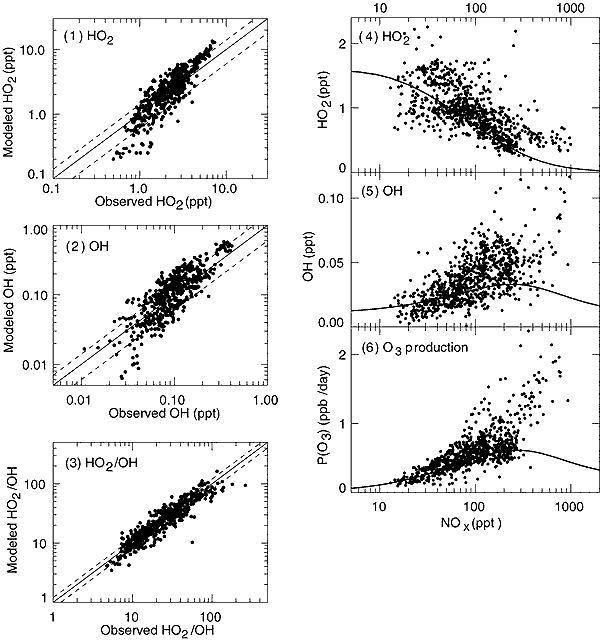
Figure 4.9: (left panel)
Observed versus modelled (1) HO2 abundance (ppt), (2) OH abundance
(ppt), and (3) HO2/OH ratio in the upper troposphere (8 to 12 km altitude)
during SONEX. Observations are for cloud-free, daytime conditions. Model calculations
are constrained with local observations of the photochemical background (H2O2,
CH3OOH, NO, O3, H2O, CO, CH4, ethane,
propane, acetone, temperature, pressure, aerosol surface area and actinic flux).
The 1:1 line (solid) and instrumental accuracy range (dashed) are shown. Adapted
from Brune et al. (1999). (right panel) Observed (4) HO2 abundance
(ppt), (5) OH abundance (ppt), and (6) derived O3 production rate (ppb/day)
as a function of the NOx (NO+NO2) abundance (ppt). Data
taken from SONEX (8 to 12 km altitude, 40° to 60°N latitude) and adapted
from Jaeglé et al. (1999). All values are 24-hour averages. The lines correspond
to model-calculated values as a function of NOx using the median photochemical
background during SONEX rather than the instantaneous values (points).