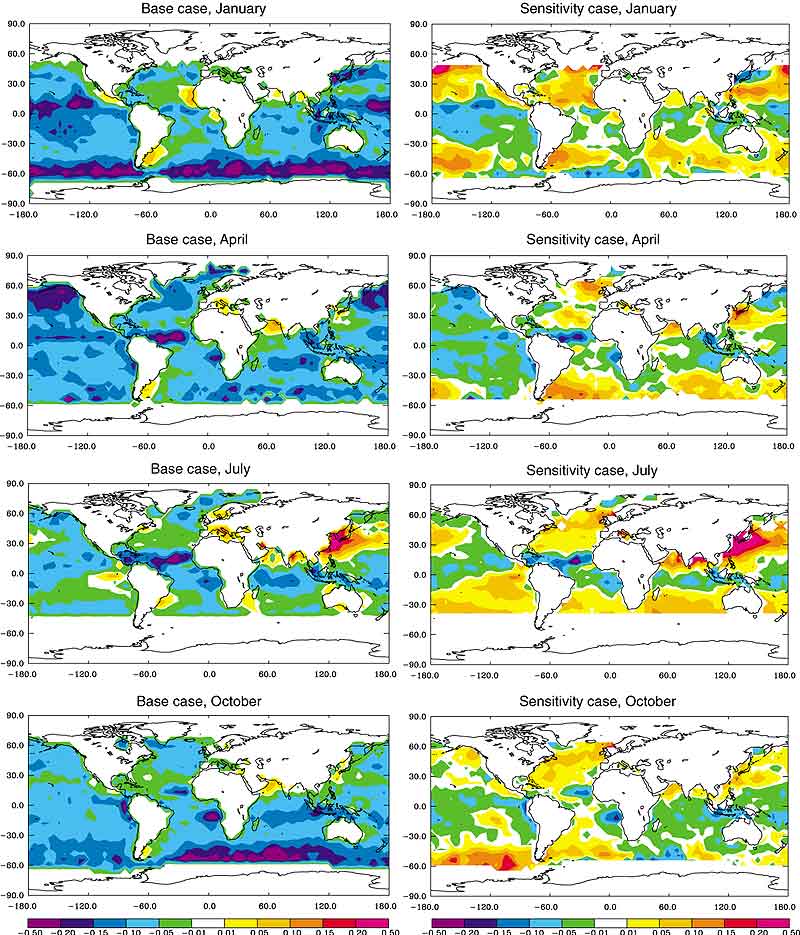
Figure 5.12: Difference
between the ECHAM/GRANTOUR computation of optical depth and the satellite-retrieved
optical depths from Mishchenko et al. (1999). The left column shows the optical
depths derived for the standard set of sources, while the right panel shows the
derived optical depths for the sensitivity study using a factor of two increase
in the DMS flux and the monthly average sea salt fluxes derived using the SSM/I
wind fields (see text). Note that the anthropogenic sulphate sources were for
the year 2000 while the satellite analysis covers the time period 1985 to 1988.
This may explain the systematic overestimate of optical depth off the coast of
Asia in July.