|
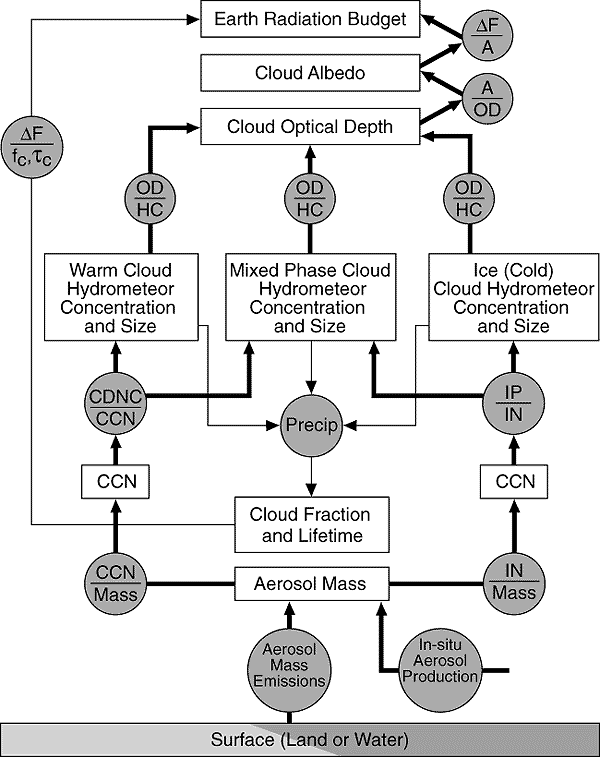
Figure 5.5: Flow chart showing the processes linking aerosol emissions or production with changes in cloud optical depth and radiative forcing. Bars indicate functional dependence of the quantity on top of the bar to that under the bar. Symbols: CCN (Cloud conden-sation nuclei); CDNC (Cloud droplet number concentration); IN (Ice nuclei); IP (Ice particles); OD (Optical depth); HC (Hydrometeor concentration); A (Albedo); fc (Cloud fraction); Dc (Cloud optical depth); tc (Radiative forcing).