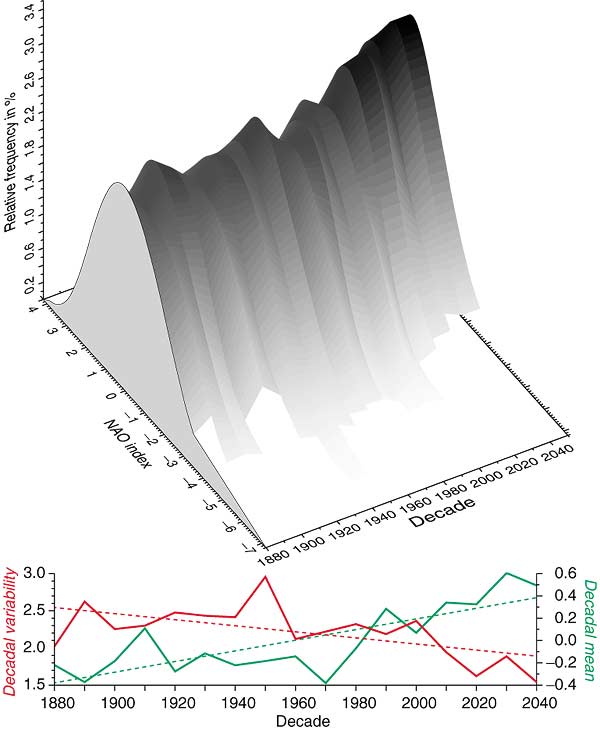
Figure 9.28: Decadal probability
density functions (PDF) of the ECHAM3/LSG transient greenhouse gas ensemble: each
PDF (greyscale bars) consists of 160 NAO index realisations including the monthly
means of November to February of the four simulations over one decade. The greyscale
background indicates the relative frequency of the classified NAO indices based
on a kernel function (Matyasovszky, 1998). The PDFs width indicates the
decadal variability. At the bottom, the time-series of the decadal mean (solid
green line) and the variability (solid red line) of each PDF as well as the corresponding
linear trends (dashed lines) are shown (from Paeth et al., 1999).