|
8.3.3. Insurers' Vulnerability and Capacity to Absorb Losses
A central component of vulnerability for public and private insurers alike
is actuarial uncertainty in the dimensions, location, or timing of extreme weather
events. This is particularly true for insurance where the rate of damage rises
faster than the driving weather phenomenon. Examples include the relationships
between peak wind speeds and structural damages (Dlugolecki et al., 1996),
average temperature changes and lightning strokes (Price and Rind, 1994; Dinnes,
1999; Reeve and Toumi, 1999), extreme temperature events and electric power
reductions or crop damages (Colombo et al., 1999) and heat stress mortality
(see Chapter 9), and precipitation and flooding (White
and Etkin, 1997).
Changes in the spatial distribution of natural disasters pose special risks
and challenges for the insurance sector. Localities to which risks shift will
tend to be relatively inexperienced and unprepared to handle such risks, potentially
resulting in a net societal increase in losses. A given insurer's vulnerability
often extends internationally. For example, U.S. insurers collected nearly 15%
of their premiums overseas in 1997, and the ratio has been growing (III, 1999).
Reinsurers have a particularly high degree of international exposure.
|

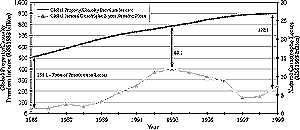
Figure 8-5: Global insured natural
catastrophe losses (right-hand scale) vs. property/casualty premium income
(left-hand scale), using a 5-year running mean. Global losses are from
Munich Re (2000) and premiums from Swiss Re (1999b and earlier years).
Note that these data include only major weather-related losses (approximately
half of total weather-related losses). Premiums include considerable revenues
(and associated reserves and surplus, not usable to pay catastrophe losses)
from non-weather-related business segments and from self-insurers. The
numbers generally include "captive" self-insurers but not the
less-formal types of self-insurance. Exposure—measured as the ratio
of premiums to losses—increased by a factor of 2.9 between the endpoints
and by 5.2 in the worst single year (1993) within this time interval.
|
|