11.2.3. Hydrology and Water Resources
11.2.3.1. Water Availability
One-third of the world's renewable water resources (13,500 km3
yr-1 out of 42,700 km3 yr-1) are concentrated
in Asia (Shiklomanov, 2001). Water availability varies widely across the different
regions of Asia, however—from 77,000 m3 yr-1 per
capita to less than 1,000 m3 yr-1 per capita. Table
11-7 provides available information on renewable local water resources,
water availability, and water use dynamics by natural-economic region of Asia.
The major share of Asian water resources (72%) is located in four countries:
Russia (3,107 km3 yr-1), China (2,700 km3 yr-1),
Indonesia (2,530 km3 yr-1), and India (1,456 km3
yr-1). Water resources of the two largest river systems of Asia—the
Ganges (with Brahmaputra and Meghna) and the Yangtze (Changjiang)—attain
1,389 km3 yr-1 (794 x 103 m3 yr-1
km-2) and 1,003 km3 yr-1 (554 x 103 m3
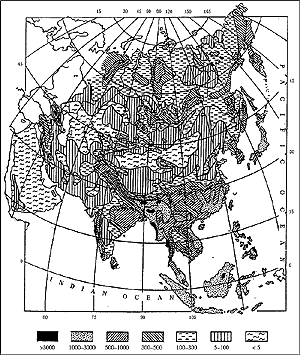
yr-1 km-2). Figure 11-11 depicts
the spatial distribution of currently estimated annual mean surface runoff over
Asia. The runoff distribution within a year in Asia is most uniform in the rivers
of southeast Asia. Over the rest of the continent, more than half of the annual
runoff is discharged during the three summer months.
|

Figure 11-11: Spatial distribution of currently estimated surface
runoff (mm) over Asian continent (Shiklomanov, 2001).
|
Water availability—in terms of temporal as well as spatial distribution—is
expected to be highly vulnerable to anticipated climate change. Growing populations
and concentration of population in urban areas will exert increasing pressures
on water availability and water quality. As reported in IPCC (1998), runoff
generally is expected to increase in the high latitudes and near the equator
and decrease in the mid-latitudes under anticipated climate change scenarios.
| Table 11-7: Renewable local water resources, water
availability, and water-use dynamics, by natural-economic regions of Asia
(Shiklomanov, 2001). |
 |
| Region |
Area
(106 km2)
|
Water Resources
(km3 yr-1)
|
Potential Water Availability
(103 m3 yr-1)
|
Dynamics of Freshwater Use (km3 yr-1)a
|
Water Use as a Percentage of Water Resourcesa
|
| |
|
|
Forecast  |
 |
|
per km2
|
per capita
|
1900
|
1950
|
1995
|
2000
|
2010
|
2025
|
1995
|
2025
|
 |
| Siberia and far east of Russia |
12.76
|
3107
|
243
|
76.6
|
0.7
|
5.6
|
30.6
|
30
|
32
|
38
|
1.0
|
1.2
|
| |
|
|
|
|
0.4
|
1.3
|
15
|
15
|
17
|
21
|
0.5
|
0.6
|
| |
|
|
|
|
|
|
|
|
|
|
|
|
| North China and Mongolia |
8.29
|
1029
|
124
|
2.13
|
37
|
98
|
254
|
273
|
305
|
373
|
24.7
|
36.2
|
| |
|
|
|
|
30
|
75
|
182
|
182
|
194
|
210
|
17.7
|
20.4
|
| |
|
|
|
|
|
|
|
|
|
|
|
|
| South Asia |
4.49
|
1988
|
443
|
1.77
|
201
|
367
|
932
|
969
|
1060
|
1370
|
43.6
|
64.1
|
| |
|
|
|
|
160
|
293
|
687
|
710
|
767
|
944
|
32.1
|
44.2
|
| |
|
|
|
|
|
|
|
|
|
|
|
|
| Southeast Asia |
6.95
|
6646
|
956
|
4.77
|
99
|
230
|
525
|
551
|
617
|
781
|
7.8
|
11.6
|
| |
|
|
|
|
77
|
170
|
388
|
393
|
413
|
425
|
5.8
|
6.3
|
| |
|
|
|
|
|
|
|
|
|
|
|
|
| Western Asia |
6.82
|
490
|
71.8
|
2.11
|
43
|
91
|
238
|
248
|
283
|
346
|
48.5
|
70.6
|
| |
|
|
|
|
34
|
71
|
174
|
181
|
201
|
229
|
35.5
|
46.7
|
| |
|
|
|
|
|
|
|
|
|
|
|
|
| Central Asia and Kazakhstan |
3.99
|
181
|
45.4
|
3.78
|
29
|
57
|
154
|
151
|
160
|
169
|
75.5
|
82.8
|
| |
|
|
|
|
19
|
37
|
102
|
102
|
110
|
122
|
50.0
|
59.8
|
| |
|
|
|
|
|
|
|
|
|
|
|
|
| Transcaucasia |
0.19
|
67.9
|
358
|
4.63
|
4.2
|
11.4
|
23.7
|
23
|
26
|
27
|
32.0
|
36.5
|
| |
|
|
|
|
2.1
|
7.1
|
17.5
|
17
|
19
|
20
|
23.7
|
27.0
|
 |
| Total |
43.50
|
13510
|
311
|
3.92
|
414
|
860
|
2157
|
2245
|
2483
|
3104
|
16.0
|
23.0
|
| |
|
|
|
|
322
|
654
|
1565
|
1603
|
1721
|
1971
|
11.6
|
14.6
|
 |
Continues on next page
|