|
13.1.6. Socioeconomic Scenarios for Europe
The four socioeconomic global futures (or SRES scenarios) described in Chapter
3 of this assessment have been characterized for Europe in the European ACACIA
study (Jordan et al., 2000), and are summarized below:
- Under a “World Market” (A1) scenario, the world becomes increasingly globalized,
and materialist-consumerist social values predominate. Global societal values
are primarily technocentric and short-termist. Nature therefore is assumed
to be largely resilient to human stress. The emphasis is on pursuing economic
growth in the narrow sense rather than sustainable development. Although rising
income levels will make everyone in Europe richer, the poorest will gain relatively
little. The EU functions as a single interconnected market, functionally integrated
with other regional markets (e.g., in Asia and North America).
- Under a “Global Sustainability” (B1) scenario, Europe is run along more
communitarian lines and within environmental resource limits. There is a strong
emphasis on finding international solutions to globally interconnected problems.
Thus, EU member states pool more and more of their sovereignty to address
common environmental problems, the causes of which are considered to lie in
the basic structure of society. The role of international institutions, including
the EU, will extend from simply regulating environmental problems to tackling
social inequality and social exclusion through adoption of social programs.
- In a “Provincial Enterprise” (A2) scenario, Europe is much more heterogeneous.
Increasingly, the organization of society is dictated by short-term consumerist
values. More policy decisions are taken at a national and subnational level.
Europe adopts more protectionist economic and trade policies, which constrain
innovation and stifle economic development, particularly in developing countries.
Growth in global GDP is more modest than under the A1 scenario, and global
inequality grows. Declining equity within and between member states of the
EU produces tension and social exclusion. This typifies the uneasy tension
in this scenario between the simultaneous desire for “free markets” (consumerist
values) and protection of national state sovereignty. Politicians prioritize
demands such as protecting the national economy and meeting short-term consumer
demands for growth over environmental quality.
- In a “Local Sustainability” (B2) scenario, Europe is more committed to
solving environmental problems by applying solutions that are attuned to local
needs and circumstances. Thus, the dominant value system is more communitarian
and ecocentric in nature, with greater commitment to longer term, strategic
planning. In a sense, the shift in governance down to the local level accords
with the principle of subsidiarity. National governments therefore are left
to perform residual functions that cannot be undertaken at the subnational
level. Small firms thrive under these conditions, whereas multinationals struggle
to realign themselves to local needs. Overall, the world (including Europe)
is more heterogeneous. Because of the lack of coordinated regional action,
however, relative inequality may increase as local problems receive higher
priority than those in other regions. Significantly, the environment benefits
under this scenario, but not nearly as much as under B1 because of the limited
extent of spatial coordination.
|

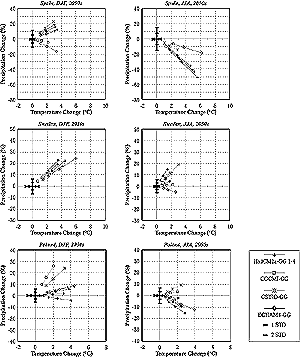
Figure 13-5: Scatter plot depicting scaled outputs of mean winter
(left panels) and summer (right panels) temperature and precipitation
change over land grid boxes representing Spain (top), Sweden (middle),
and Poland (bottom) from each of seven GCM simulations (GFDL simulations
are not shown because they extend only to 2025). Lines connect four points
for each GCM simulation, each point representing standardized regional
changes in climate from the GCM, linearly scaled according to global warming
from each of the four ACACIA scenarios. The order of points along a line
from the origin is the same for all plots: B1-low, B2-mid, A1-mid, A2-high.
Also plotted are 1 and 2 standard deviation limits from 1,400-year HadCM2
unforced simulation, which is used to indicate natural multi-decadal variability.
|
|