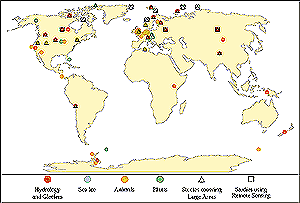
Figure TS-11: Locations at which systematic long-term studies meet
stringent criteria documenting recent temperature-related regional climate
change impacts on physical and biological systems. Hydrology, glacial retreat,
and sea-ice data represent decadal to century trends. Terrestrial and marine
ecosystem data represent trends of at least 2 decades. Remote-sensing studies
cover large areas. Data are for single or multiple impacts that are consistent
with known mechanisms of physical/biological system responses to observed
regional temperature-related changes. For reported impacts spanning large
areas, a representative location on the map was selected. |
7. Global Issues and Synthesis
7.1. Detection of Climate Change Impacts
Observational evidence indicates that climate changes in the 20th century already
have affected a diverse set of physical and biological systems. Examples of
observed changes with linkages to climate include shrinkage of glaciers; thawing
of permafrost; shifts in ice freeze and break-up dates on rivers and lakes;
increases in rainfall and rainfall intensity in most mid- and high latitudes
of the Northern Hemisphere; lengthening of growing seasons; and earlier flowering
dates of trees, emergence of insects, and egg-laying in birds. Statistically
significant associations between changes in regional climate and observed changes
in physical and biological systems have been documented in freshwater, terrestrial,
and marine environments on all continents. [19.2]
The presence of multiple causal factors (e.g., land-use change, pollution)
makes attribution of many observed impacts to regional climate change a complex
challenge. Nevertheless, studies of systems subjected to significant regional
climate change—and with known sensitivities to that change—find changes
that are consistent with well-established relationships between climate and
physical or biological processes (e.g., shifts in the energy balance of glaciers,
shifts in the ranges of animals and plants when temperatures exceed physiological
thresholds) in about 80% of biological cases and about 99% of physical cases.
Table TS-16 shows ~450 changes in processes or species
that have been associated with regional temperature changes. Figure
TS-11 illustrates locations at which studies have documented regional temperature
change impacts. These consistencies enhance our confidence in the associations
between changes in regional climate and observed changes in physical and biological
systems. Based on observed changes, there is high confidence that 20th century
climate changes have had a discernible impact on many physical and biological
systems. Changes in biota and physical systems observed in the 20th century
indicate that these systems are sensitive to climatic changes that are small
relative to changes that have been projected for the 21st century. High sensitivity
of biological systems to long-term climatic change also is demonstrated by paleorecords.
[19.2.2.]
Signals of regional climate change impacts are expected to be clearer in physical
and biotic systems than in social and economic systems, which are simultaneously
undergoing many complex non-climate-related stresses, such as population growth
and urbanization. Preliminary indications suggest that some social and economic
systems have been affected in part by 20th century regional climate changes
(e.g., increased damages by floods and droughts in some locations, with apparent
increases in insurance impacts). Coincident or alternative explanations for
such observed regional impacts result in only low to medium confidence about
determining whether climate change is affecting these systems. [19.2.2.4]
| Table TS-16: Processes and species found in studies
to be associated with regional temperature change.a |
 |
| Region |
Glaciers, Snow Cover/ Melt, Lake/ Stream Iceb
|
Vegetation
|
Invertebrates
|
Amphibians and Reptiles
|
Birds
|
Mammals
|
|
| Africa |
1
|
0
|
—
|
—
|
—
|
—
|
—
|
—
|
—
|
—
|
—
|
—
|
| Antarctica |
3
|
2
|
2
|
0
|
—
|
—
|
—
|
—
|
2
|
0
|
—
|
—
|
| Asia |
14
|
0
|
—
|
—
|
—
|
—
|
—
|
—
|
—
|
—
|
—
|
—
|
| Australia |
1
|
0
|
—
|
—
|
—
|
—
|
—
|
—
|
—
|
—
|
—
|
—
|
| Europe |
29
|
4
|
13
|
1
|
46
|
1
|
7
|
0
|
258
|
92
|
7
|
0
|
| North America |
36
|
4
|
32
|
11
|
—
|
—
|
—
|
—
|
17
|
4
|
3
|
0
|
| Latin America |
3
|
0
|
—
|
—
|
—
|
—
|
22
|
0
|
15
|
0
|
—
|
—
|
| Total |
87
|
10
|
47
|
12
|
46
|
1
|
29
|
0
|
292
|
96
|
10
|
0
|
|
7.2. Five Reasons for Concern
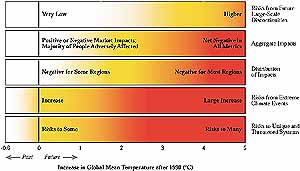
Figure TS-12: Impacts of or risks from climate change, by reason
for concern. Each row corresponds to a reason for concern, and shades correspond
to severity of impact or risk. White means no or virtually neutral impact
or risk, yellow means somewhat negative impacts or low risks, and red means
more negative impacts or higher risks. Global-averaged temperatures in the
20th century increased by 0.6°C and led to some impacts. Impacts are
plotted against increases in global mean temperature after 1990. This figure
addresses only how impacts or risks change as thresholds of increase in
global mean temperature are crossed, not how impacts or risks change at
different rates of change in climate. These temperatures should be taken
as approximate indications of impacts, not as absolute thresholds. |
Some of the current knowledge about climate change impacts,
vulnerability, and adaptation is synthesized here along five reasons for concern:
unique and threatened systems, global aggregate impacts, distribution of impacts,
extreme weather events, and large-scale singular events. Consideration of these
reasons for concern contribute to understanding of vulnerabilities and potential
benefits associated with human-induced climate change that can aid deliberations
by policymakers of what could constitute dangerous interference with the climate
system in the context of Article 2 of the UNFCCC. No single dimension is paramount.
Figure TS-12 presents qualitative findings about climate
change impacts related to the reasons for concern. At a small increase in global
mean temperature,3
some of the reasons for concern show the potential for negative impacts, whereas
others show little adverse impact or risk. At higher temperature increases,
all lines of evidence show a potential for adverse impacts, with impacts in
each reason for concern becoming more negative at increasing temperatures. There
is high confidence in this general relationship between impacts and temperature
change, but confidence generally is low in estimates of temperature change thresholds
at which different categories of impacts would happen. [19.8]
7.2.1. Unique and Threatened Systems
Small increases in global average temperature may cause significant and irreversible
damage to some systems and species, including possible local, regional, or global
loss. Some plant and animal species, natural systems, and human settlements
are highly sensitive to climate and are likely to be adversely affected by climate
changes associated with scenarios of <1°C mean global warming. Adverse
impacts to species and systems would become more numerous and more serious for
climatic changes that would accompany a global mean warming of 1-2°C and
are highly likely to become even more numerous and serious at higher temperatures.
The greater the rate and magnitude of temperature and other climatic changes,
the greater the likelihood that critical thresholds of systems would be surpassed.
Many of these threatened systems are at risk from climate change because they
face nonclimate pressures such as those related to human land use, land-use
change, and pollution. [19.3]
Species that may be threatened with local or global extinction by changes in
climate that may accompany a small mean global temperature increase include
critically endangered species generally, species with small ranges and low population
densities, species with restricted habitat requirements, and species for which
suitable habitat is patchy in distribution, particularly if under pressure from
human land-use and land-cover change. Examples of species that may be threatened
by small changes include forest birds in Tanzania, the Resplendent Quetzal in
Central America, the mountain gorilla in Africa, amphibians that are endemic
to cloud forests of the neotropics, the spectacled bear of the Andes, the Bengal
tiger and other species that are endemic to the Sundarban wetlands, and rainfall-sensitive
plant species that are endemic to the Cape Floral Kingdom of South Africa. Natural
systems that may be threatened include coral reefs, mangroves, and other coastal
wetlands; montane ecosystems that are restricted to the upper 200-300 m of mountainous
areas; prairie wetlands; remnant native grasslands; coldwater and some coolwater
fish habitat; ecosystems overlying permafrost; and ice edge ecosystems that
provide habitat for polar bears and penguins. Human settlements that may be
placed at serious risk by changes in climate and sea level that may be associated
with medium to large mean warming include some settlements of low-lying coastal
areas and islands, floodplains, and hillsides—particularly those of low
socioeconomic status such as squatter and other informal settlements. Other
potentially threatened settlements include traditional peoples that are highly
dependent on natural resources that are sensitive to climate change. [19.3]
|