|

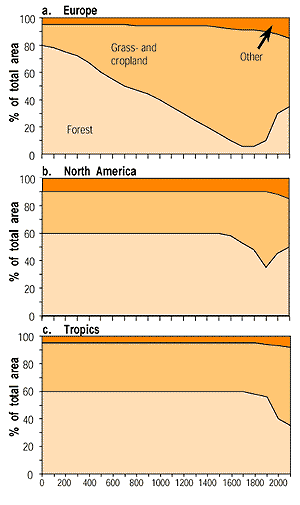
Figure 4.4: Indicative figure displaying historical changes in
land use in three world regions. The presented values should not be taken
as absolute, because the historical evidence is often only anecdotal (Mather,
1990; Kauppi et al., 1992; Palo and Uusivuori, 1999; Farrell
et al., 2000).
|
4.2.2 Land Use in the Temperate and
Boreal Zones
4.2.2.1 Historical and Present Land Use in the Temperate
and Boreal Zones
The temperate zone is the most populated zone of the world, while the boreal
zone is quite sparsely populated. For thousands of years forest area has diminished,
particularly in the temperate zone, as forests were cleared for agriculture
and pasture. Clearing of the European Mediterranean region began ca 5000 years
ago; in Central Europe and in China deforestation occurred in early Medieval
times; in parts of Russia and Mongolia forest clearing occurred in late Medieval
times; and in North America clearing occurred mainly in the 19th century (Mather,
1990, see Figure 4.4). Since the mid 20th century the net
forest area of the temperate zone has no longer decreased but has instead increased
(Kauppi et al., 1992). The inner parts of the boreal zone in Siberia,
Alaska, and Canada have not been subject to significant land-use management.
The opportunities present to store carbon in terrestrial ecosystems in the boreal
and temperate zones are thus very much determined by historical land-use change
and the associated losses of carbon (Kurz and Apps, 1999).
Understanding the historic and current net sink of C in the temperate and boreal
zones is important to assessing the potential of present and future management
options. In general, estimates of C flows have been based on a variety of methods
and data, resulting in a wide range of reported values for C flows per region.
The confidence level in each separate value is therefore low. For example, for
European forests the estimates of the present C sink vary from almost 0 to 0.5
GtC/yr (Nabuurs et al., 1997; Martin et al., 1998; Valentini et
al., 2000; Schulze, 2000). For Canada, early estimates, based on a static
assessment, indicated a net sink of 0.08GtC/yr for the mid-1970s (Kurz et
al., 1992); whereas subsequent analyses, accounting for changes in forest
disturbances over time (see section 4.2.3), indicated
that Canadian forests became a small net source of C (–0.068GtC/yr) by
the early 1990s (Kurz and Apps, 1999). Estimates of carbon accumulation in woody
biomass for the USA also show a large uncertainty. While the average rate for
the USA C sink ranges from 0.020 to 0.098GtC/yr for the 1980s and 1990s (Birdsey
and Heath, 1995; Turner et al., 1995; Houghton et al., 1999),
atmospheric inversion models applied to the North American continent suggest
a sink of 1.7 ± 0.5GtC/yr, largely south of 51ºN (Fan et al.,
1998), but with very low levels of confidence (Bolin et al., 2000).
In the less intensively managed forests of Russia and Canada, changes in mortality
associated with natural disturbances appear to dominate over management influences
(see Section 4.2.4). In European Russia, managed forest
ecosystems were estimated to be a sink of 0.051GtC/yr between 1983 and 1992,
but the less actively managed Siberian forest was a net source of 0.081–0.12GtC/yr
(Shepashenko et al., 1998). The available estimates for Siberia differ
even more than for the other regions mentioned above, and their confidence level
may be “low” (Schulze et al., 1999).
Recent FAO statistics on 55 countries in the temperate and boreal zones indicate
a general increase in the forest carbon stock (trees only) of 0.88GtC/yr (UN-ECE/FAO,
2000). Changes in forest management and changes in the environment have contributed
to this trend. In Europe, the trend is consistent with the observation of increased
growth in individual stands noted by Spiecker et al. (1996). The FAO
statistics indicate that between the 1980s and 1990s both net annual increment
and timber fellings increased, but that the rate of change was lower for fellings
than for growth, resulting in a substantial increase in the carbon sink from
the 1980s to the 1990s (Kuusela, 1994; Kauppi et al., 1992; Sedjo, 1992;
Dixon et al., 1994; UN-ECE/FAO, 2000). The carbon sink in live woody
vegetation was on the order of 10% of the fossil fuel CO2 emissions
in the USA and in western Europe, and higher in the 1990s than in the 1980s
(c.f. Kauppi et al., 1992).
These relatively high sequestration rates are not a result of active policies
aimed at climate mitigation, but less rather appear to be related to general
trends in land use and land-use change. In the USA, Schimel et al. (2000)
and Houghton et al. (1999) estimate that the observed sink is a result
mainly of changes in land use and land management, rather than a response to
changes in the environment. The latest observations, based on forest inventory
data (UN-ECE/FAO, 2000), are reflected in the Special Report on LULUCF (IPCC,
2000a). The IPCC (2000a) estimates that the total global terrestrial biopheric
sink in the 1990s amounted to 0.7GtC/yr, despite a source from land-use change
in the tropics of 0.9GtC/yr
|