8.2.1.1 National and Regional Cost Studies Assuming Large Potentials for Efficiency
Gains (the Impact of No Regrets or Non-price Policies)
An important part of climate policy debates is underpinned by a lasting controversy
between believers and non-believers in the existence of a large untapped efficiency
potential in the economy. If there, this potential could be realized at such
a small societal cost that it would be more than compensated by cost savings
that accrue from the efficiency improvements. Options that have a negative net
social cost add up to an overall negative cost potential that may be quite large.
Figure 8.1 is a sketch of the successive marginal costs
of abatement, as a function of GHG reduction relative to some baseline point
A. The total cost is simply the area between the curve and the horizontal axis.
From A to B, marginal abatement costs are negative, and from B onwards, they
are positive. The debate revolves around the size of the total (negative) cost
from A to B. The studies discussed in this subsection argue that the negative
cost area is potentially quite significant, and compensates to a large extent
for the positive costs incurred after point B. Most other B-U studies analyzed
in the next subsection do not even attempt to evaluate the relative positions
of points A and B, since they optimize the system even in the absence of carbon
constraint, and thus compute only the points beyond point B.
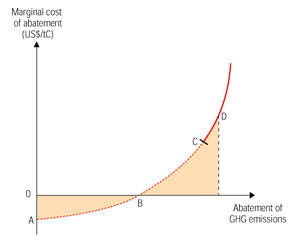
Figure 8.1: A typical cost curve. |
Krause (1995, 1996) identifies two main reasons why the negative cost area
may be quite large: untapped potential for efficiency gains mainly in end-use
technologies, both on the demand and on supply sides. Several major studies
concretize this view in Europe as well as in North America (USA and Canada).
For Europe, the monumental IPSEP reports (summarized in Krause et al.
(1999)) conclude that emissions could be reduced by up to 50% below the 1990
level by 2030, at a negative overall cost. This involves the judicious implementation
of technologies and practices in all sectors of the economy, and the application
of a large number of government policies (incentives, efficiency standards,
and educational). In the US, some of the 5-Lab studies (Brown et al.,
1997a, 2000, particularly the HE/LC scenario) indicate that the Kyoto reduction
target could be reached at negative overall cost ranging from –US$7 billion
to –US$34 billion. Another study based on the NEMS model (Koomey et
al., 1998) indicates that 60% of the Kyoto gap could be bridged with an
overall increase in the US GDP. The latter study contrasts with another NEMS
study (Energy Information Administration, 1998) that indicates GDP losses from
1.7% to 4.2% (depending on the extent of permit trading and sink options) for
the USA to reach the Kyoto targets. Laitner (1997, 1999) further stresses the
impact of efficient technologies on the aggregate cost of mitigation in the
USA. In Canada, the MARKAL model was used with and without certain efficiency
measures in various sectors (Loulou and Kanudia, 1998; Loulou et al., 2000):
the results show costs of Kyoto equal to US$20 billion without the additional
efficiency measures, versus –US$26 billion when efficiency measures are
included in the database. Again in Canada, the ISTUM model was used (Jaccard
et al., 1996, Bailie et al., 1998) considering a set of pro-active
options. For example, in the residential sector large emissions reductions of
17% to 25% relative to 1990 could be achieved as early as 2008 with many negative
costs options, and beyond that level of reduction, the marginal costs is ranging
from US$25 to US$89/tC.
As extensively discussed in SAR, many economists argue that the real magnitude
of negative cost options is not so large if account is taken of:
- Transaction costs of removing market imperfections that inhibit the adoption
of the best technologies and practices;
- Hidden costs, such as the risks of using a new technology (maintenance costs,
quality of services);
- “Rebound effect“ because, for example, an improvement in motor
efficiency lowers the cost per kilometre driven and has the perverse effect
of encouraging more trips; and
- Real preferences of consumers: options such as driving habits and modal
switches towards rail and mass transit are considered to entail negative costs.
This does not consider enough the reality of consumers’ behaviour preferences
for flexibility and non-promiscuity in transportation modes, or even “symbolic”
consumption (such as the preference for high-power cars even in countries
with speed limits).
These arguments should not be used to refute the very existence of negative
cost potentials. They indicate that the applicability of non-price policy measures
apt to overcome barriers to the exploitation of these potentials must be given
serious attention. Some empirical observations do confirm that active sectoral
policies can result in significant efficiency gains, in demand-side management
for electricity end-uses for example. However, the many sources of gaps between
technical costs and economic costs cannot be ignored (see the taxonomy of Jaffe
and Stavins, 1994). The few existing observations (Ostertag, 1999) suggest that
the transaction costs may represent, in many cases, a large fraction of the
costs of new technology, and there is always an uncertainty about the efficiency
and the political acceptability of the policies suggested in the above studies.
This issue is clearly exemplified by the set of studies carried out in the USA
and collected under the name “5-LAB studies”. In these, some scenarios
produce positive incremental costs and others negative costs, depending on the
aggressiveness with which efficiency measures are implemented (Interlaboratory
Working Group, 1997; Brown et al., 1998).
8.2.1.2 Bottom-up Costs Resulting from Carbon Pricing (Developed
Countries)
Contrary to the studies discussed above, the partial equilibrium studies reviewed
in this section do not report negative costs. This is because the least-cost
algorithms employed, which are powerful to compute the incremental cost of the
system with and without a carbon constraint (i.e., point B in Figure
8.1), demand a set of somewhat arbitrary parameters to be calibrated in
such a way that they calculate a suboptimal baseline; but such an operation
demands resorting to a set of somewhat arbitary parameters and the results are
less easy to interpret. This is why the B-U studies reported hereafter explore
only the section of the cost curve with positive carbon prices (section CD in
Figure 8.1).
It is very hard to encapsulate in a short presentation the many studies carried
out with a B-U approach using a crosscutting, carbon-pricing instrument. Figure
8.1 summarizes a number of these results, obtained with a variety of B-U
models applied to a single Annex I country or region, ignoring the trade effects.
Included are those studies that contain enough information to present the marginal
abatement cost along with the level of GHG emission variation from 1990 (other
studies that reported only the total abatement cost are discussed separately).
In Figure 8.2, each point represents one particular
reduction level (relative to 1990) and the corresponding marginal cost of reduction.
Points that are linked together by a line correspond to a multi-run study effected
with the same model, but in which the amount of reduction was varied.
Evidently, Figure 8.2 shows considerably discrepancies
from study to study. These large variations are explained by a number of factors,
some of which reflect the widely differing conditions that prevail in the countries
studied, while others result from the modelling and scenario assumptions. These
variations are discussed next, illustrated by examples from Figure
8.2.
8.2.1.2.1 Cost Discrepancies that Result from Specific
Country Conditions
- Energy endowment. Countries that are richly endowed with fossil fuels
find it generally less expensive to replace coal with gas, and thus have a
greater potential than other countries to reduce emissions with readily available
means. (This assumes that the change is not done very rapidly, so as to affect
as little as possible the turnover rate of the existing investments.) For
instance, this is the case for the USA (coal and oil products)2.
At the other extreme of the spectrum some countries have fuelled their economy
almost exclusively on hydropower, nuclear power, and some gas, and will thus
find fewer opportunities to switch to less CO2-intensive fuels.
This occurs for Norway (hydro), France (nuclear and hydro), Japan (nuclear
and some fossil fuels), Switzerland (hydro and nuclear), and to some extent
Canada (hydro and nuclear).
- Economic growth. An economy with high growth rate faces the following
dilemma. On the one hand, the growth allows for a rapid capital turnover,
and thus many opportunities to install efficient or low-carbon technologies.
On the other hand, the same economy requires more energy precisely because
of its fast growth. The net result is that such countries have a tendency
to decrease markedly their energy intensity (energy per GDP), but to increase
significantly their total emissions. For such countries, a net reduction of
GHG emissions below a base year’s emissions is usually costly. Typically,
many fast-developing countries in East and South East Asia are in this category.
In the studies cited above, their emissions “reductions” are often
computed relative to the baseline rather than to a fixed base year.
- Energy intensity. The degree of energy intensity of an economy acts
in opposing directions when the economy wishes to achieve net emissions reductions:
on the one hand, a high degree of energy intensity may occur because that
the country has not yet implemented some efficiency measures implemented elsewhere.
On the other hand, such an economy may have been built on energy, and may
thus find it hard to veer to a different, less energy-intensive mode, in a
short time. Its development path is somewhat frozen, at least in the short
term. The higher the carbon intensity, the more important the time frame of
abatement. Such a pattern is observable in North America; despite its rapid
capital turnover in the industry, the large inertia in sectors such as transportation
is a determining factor of high abatement cost when the required abatement
implies short term actions on these sectors.
- Other specific conditions. For example, Germany faces a very special
situation because of the reunification in 1990 to 1991. The East German part
of the country emits much less now than in 1990, and the country as a whole
is able to effect significant reductions at essentially zero or very low cost,
up to a certain point, beyond which its marginal cost may well accelerate
considerably.
8.2.1.2.2 Discrepancies in Results Due to Modelling and
Scenario Assumptions
- Policy assumptions. The results summarized in Figure
8.2 are based mostly on partial equilibrium models, which tend to approach
general equilibrium computations, such as AIM, NEMS, MARKAL, MARKAL-MACRO,
PRIMES, CIMS, etc. Some of these models allow evaluation of the impact on
mitigation cost of the redistribution of the proceeds of a carbon tax (the
results obtained with the AIM model for Japan (Kainuma et al., 1999,
2000) show very clearly that suitable redistribution reduces the marginal
cost of abatement).
- Modelling differences. Some models include partial economic feedbacks
in the form of demand elasticities, as for example MARKAL (Loulou and Kanudia,
1999a), and for these models the abatement marginal costs are generally lower
than when demands are fixed, because it becomes unnecessary to tap the most
costly technological options. MARKAL-MACRO and NEMS include macroeconomic
components in the computation of the equilibrium, and therefore qualify as
general equilibrium models, albeit simplified ones. In addition, these two
models include behavioural considerations in the calculation of the equilibrium,
which tend to raise the cost of abatement, compared to least-cost models such
as MARKAL.
- Scenario variation. The variety of scenarios used is quite large,
as a result of varying some or all of the relevant elements. These include
whether the technologies are allowed to penetrate freely or in a limited fashion
(typically renewables, nuclear, and some new end-use technologies), the basket
of GHG gases considered (CO2 alone versus multigas studies), assumed
economic growth, and sectoral scope (energy only versus whole economy).
- Example. To illustrate the above comments, Figure
8.2 indicates that at a marginal cost of less than US$100/tCO2eq,
the US emissions would still be larger in 2010 than in 1990, according to
the NEMS (Energy Information Administration, 1998) and MARKAL (Interagency
Analytical Team, 1997) studies. Note that NEMS predicts higher marginal costs
than MARKAL for the same emission level, as expected, since NEMS includes
many behavioural considerations, whereas MARKAL is a least-cost model. Japan’s
emissions would be reduced by 1% to 8% (AIM studies (Kainuma et al.,
1999, 2000); Ireland’s (Conniffe et al., 1997) and Italy’s
(Contaldi and Tosato, 1999) emissions would also increase, whereas Canada’s
emissions would decrease by 6% (MARKAL study (Loulou et al., 1998)).
The several European studies show a wide range of reductions, from relatively
small reductions (PRIMES study (Capros et al., 1999a)) to medium or
large reductions with the various MARKAL studies (Gielen and Pieters, 1999;
Gielen et al., 1999a; Ybema et al., 1999). These large variations
are mainly explained by the modelling and scenario assumptions: PRIMES marginal
costs are expected to be larger than MARKAL’s (just as NEMS costs were
larger than MARKAL’s in the US case). In addition, scenario assumptions
vary across studies: the number of gases modelled, degree of efficiency of
the instrument used across the EU countries, and availability of international
permits trading.
Several studies are not represented in Figure 8.2,
since only incremental or average costs were reported. For instance, a German
study (Jochem, 1998) indicates reductions of 30% to 40% in 2010 at average costs
ranging from US$12 to US$ 68/tCO2eq. In Canada (Loulou and Lavigne,
1996), a measure of the impact of demand reduction is obtained by running MARKAL
with and without elastic demands for energy services: the total cost is US$52
billion with fixed demands, andUS$42 billion with elastic demands. Chung et
al. (1997) arrive at much higher total costs for Canada, using a North American
equilibrium level (the higher cost apparently results from fewer technological
options than in MARKAL) A Swedish MARKAL study (Nystrom and Wene, 1999) find
total cost of 210 billion Swedish krona for a stabilization scenario, against
640 billion Swedish krona for a 50% emissions reduction in 2010. This same study
investigates the opportunity cost of a nuclear phase out, and evaluates a rebound
effect on the demands of a 9% emissions reduction for Sweden.
|