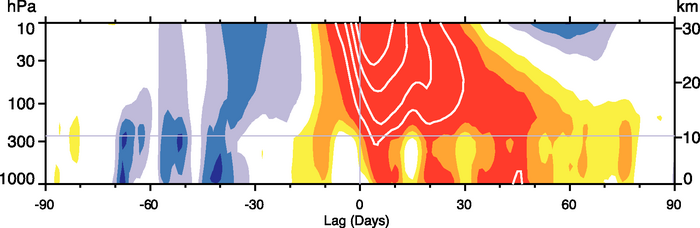
Box 3.3: Stratospheric-Tropospheric Relations and Downward Propagation The troposphere influences the stratosphere mainly through planetary-scale waves that propagate upward during the extended winter season when stratospheric winds are westerly. The stratosphere responds to this forcing from below to produce long-lived changes to the strength of the polar vortices. In turn, these fluctuations in the strength of the stratospheric polar vortices are observed to couple downward to surface climate (Baldwin and Dunkerton, 1999, 2001; Kodera et al., 2000; Limpasuvan et al., 2004; Thompson et al., 2005). This relationship occurs in the zonal wind and can be seen clearly in annular modes, which explain a large fraction of the intra-seasonal and interannual variability in the troposphere (Thompson and Wallace, 2000) and most of the variability in the stratosphere (Baldwin and Dunkerton, 1999). Annular modes appear to arise naturally as a result of internal interactions within the troposphere and stratosphere (Limpasuvan and Hartmann, 2000; Lorenz and Hartmann, 2001, 2003). The relationship between NAM anomalies in the stratosphere and troposphere can be seen in Box 3.3, Figure 1, in which the NAM index at 10 hPa is used to define events when the stratospheric polar vortex was extremely weak (stratospheric warmings). On average, weak vortex conditions in the stratosphere tend to descend to the troposphere and are followed by negative NAM anomalies at the surface for more than two months. Anomalously strong vortex conditions propagate downwards in a similar way. Long-lived annular mode anomalies in the lowermost stratosphere appear to lengthen the time scale of the surface NAM. The tropospheric annular mode time scale is longest during winter in the NH, but longest during late spring (November–December) in the SH (Baldwin et al., 2003). In both hemispheres, the time scale of the tropospheric annular modes is longest when the variance of the annular modes is greatest in the lower stratosphere. Downward coupling to the surface depends on having large circulation anomalies in the lowermost stratosphere. In such cases, the stratosphere can be used as a statistical predictor of the monthly mean surface NAM on time scales of up to two months (Baldwin et al., 2003; Scaife et al., 2005). Similarly, SH trends in temperature and geopotential height, associated with the ozone hole, appear to couple downward to affect high-latitude surface climate (Thompson and Solomon, 2002; Gillett and Thompson, 2003). As the stratospheric circulation changes with ozone depletion or increasing greenhouse gases, those changes will likely be reflected in changes to surface climate. Thompson and Solomon (2005) showed that the spring strengthening and cooling of the SH polar stratospheric vortex preceded similarly signed trends in the SH tropospheric circulation by one month in the interval 1973 to 2003. They argued that similar downward coupling is not evident in the NH geopotential trends computed using monthly radiosonde data. An explanation for this difference may be that the stratospheric signal is stronger in the SH, mainly due to ozone depletion, giving a more robust downward coupling. The dynamical mechanisms by which the stratosphere influences the troposphere are not well understood, but the relatively large surface signal implies that the stratospheric signal is amplified. The processes likely involve planetary waves (Song and Robinson, 2004) and synoptic-scale waves (Wittman et al., 2004), which interact with stratospheric zonal wind anomalies near the tropopause. The altered waves would be expected to affect tropospheric circulation and induce surface pressure changes corresponding to the annular modes (Wittman et al., 2004).