|
5.4. Calculated Impact of Aviation on UV at the Surface of the Earth
Present and future fleets of aircraft have the capacity to modify the amount
of UV arriving at the surface of the Earth as a result of changes brought about
by:
The amount and distribution of ozone in the upper troposphere and lower stratosphere
The amount of cloud cover
The aerosol type, content, and distribution.
This section discusses the expected magnitudes of the effects of each of these
changes and compares the calculated impact of aviation on UV at the ground with
that resulting from other changes in the composition of the atmosphere.
Many of the results discussed in this section are expressed in terms of percent
change in UVery between two scenarios being compared. The relationships between
UVery, the erythemal weighting factor, the ground-level irradiance, and the
erythemally weighted irradiance are illustrated in Figure
5-1 for 30°N for July and January.
So that percent change in UVery may be put in context in terms of absolute
irradiance, Figure 5-2 shows the calculated spatial
and seasonal variation of the absolute value for UVery with latitude for the
1992 background atmosphere.
5.4.1. Methodology for Treating Changes in Atmospheric
Ozone
Table 5-1: Ozone columns (Dobson units): Monthly,
zonal averages (1983-1992) from TOMS.*
|
| Latitude |
January |
April |
July |
October |
| 65°S |
318.8 |
299.2 |
(380.0) |
312.7 |
| 45°S |
303.4 |
286.3 |
324.3 |
353.7 |
| 30°S |
275.7 |
269.0 |
290.2 |
310.1 |
| 0° |
250.1 |
260.1 |
264.9 |
265.8 |
| 30°N |
275.3 |
308.9 |
294.1 |
272.5 |
| 45°N |
352.8 |
373.0 |
326.0 |
295.0 |
| 65°N |
(380.0) |
424.3 |
329.2 |
304.8 |
|
|
* There are no TOMS measurements for winter at high
latitudes. The values shown in parentheses for winter at 65°S
and N are the values given for winter subarctic columns
in Anderson et al. (1986). The distributions of ozone with altitude
for the columns shown in Table 5-1 are derived
from Park et al. (1999). |
|
The underlying principle for the methodology described below is that calculations
of ozone changes derived from chemical transport models should be related to
measurements. For this chapter, calculations designed to determine ozone changes
for the present and the future have been related to present-day measurements
of ozone columns and profiles. Model calculations are then used to estimate
the impact of aviation in 1970, 1992, 2015, and 2050. The modeled impacts are
compared with other changes that are calculated to have occurred to ozone columns
since 1970 and predicted to occur between 1992 and 2050. The radiative transfer
calculations reported in this chapter were performed using a stand-alone version
of the solar radiation module from the Commonwealth Scientific and Industrial
Research Organisation (CSIRO) 2-D chemical transport model (CTM), which has
been described in Stolarski et al. (1995) and Randeniya et al. (1997). The method
of Meier et al. (1982) is used to account for the effects of multiple scattering,
and ray-tracing techniques are used to account for the curvature of the Earth.
The CSIRO radiative transfer model participated in the photolysis benchmark
intercomparison conducted as part of the 1995 Atmospheric Effects of Stratospheric
Aircraft (AESA) assessment (Stolarski et al., 1995), and excellent agreement
was obtained with the benchmark calculations. Intercomparisons have also been
performed with the Tropospheric Ultraviolet and Visible (TUV) model developed
by Madronich using calculations made at the Laboratory of Atmospheric Physics
at the University of Thessaloniki. The radiative transfer equation in TUV was
solved by using the discrete ordinate radiative transfer (DISORT) code in 16-stream
mode (Stamnes et al., 1988). Erythemally weighted fluxes were calculated at
the ground under clear-sky conditions for zenith angles from 0 to 80°. Using
the same input parameters, agreement was obtained with the CSIRO model to within
2-3% for zenith angles up to 60° and within 5% for a zenith angle of 80°.
5.4.1.1. Ozone Columns and Profiles
 |
|
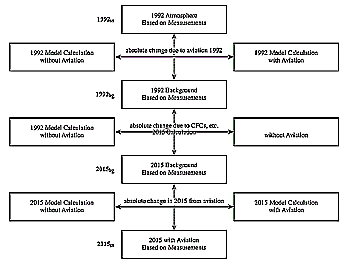
Figure 5-3: Illustration of the derivation of columns used
for UV calculations.
|
The calculations address the effect of aviation on UV at the surface in 1970,
1992, 2015, and 2050. For the years 2015 and 2050, there will be a range of
scenarios that will be influenced primarily by the expected size and composition
of the fleets and the amount and composition of emissions. In principle, however,
the UV calculations require a representation of a background atmosphere and
an atmosphere that includes the effects of aircraft emissions for each of the
years 1970, 1992, 2015, and 2050. The term "background" in this context refers
to an atmosphere derived from a calculation that includes all expected inputs
other than those attributable to aircraft emissions. The calculated impacts
of aviation on ozone for 1992, 2015, and 2050 are provided by Chapter
4. The small effect calculated for 1970 is deduced from the 1992 calculations,
as discussed in Section 5.4.1.2.
The starting point for subsequent calculations is the representation of ozone
columns and profiles for 1992. For this chapter, the columns have been derived
from archived TOMS version 7 measurements (Herman et al., 1996). UV calculations
have been performed at local noon for January, April, July, and October at the
following latitudes: 65°S, 45°S, 30°S, 0, 30°N, 45°N, and 65°N. The monthly
averaged and zonally averaged ozone columns derived from the TOMS data for these
months and latitudes for the 10-year period 1983 to 1992 are shown in Table
5-1.
Because the values shown in Table 5-1 are averages
of measured values, they already include the effects of present-day aircraft
emissions on ozone. In other words, to obtain the 1992 background atmosphere,
the effects of emissions from aircraft have to be removed from the values shown
in Table 5-1. The manner in which this has been
done for these calculations and the extension of the methods applied to obtain
the required information for the years 1970, 2015, and 2050 are illustrated
in Figure 5-3.
All calculations ultimately have averaged values for ozone given in Table
5-1 as their reference. These 1992 values are represented by 1992ss (where
the subscript defines an atmosphere containing emissions from a fleet of subsonic
aircraft) in Figure 5-3. Chemical transport calculations
are carried out to generate model atmospheres for 1992 that (a) do not include
inputs attributable to aviation and (b) do include these inputs. Comparison
of the results of these calculations allows one to determine the absolute differences
in ozone concentrations predicted by the model.
Table 5-2: Brief scenario description.
|
| Symbol |
Description |
Chapter 4 Reference |
| 1992bg |
1992 background |
Scenario A: Table 4-4 |
| 1992ss |
1992 including subsonics |
Scenario B: Table 4-4 |
| 2015bg |
2015 background |
Scenario C: Table 4-4 |
| 2015ss |
2015 including subsonics |
Scenario D: Table 4.4 |
| 2015hf |
2015 subsonic/supersonic hybrid fleet |
Scenario S1k: Table 4-11 |
| 2050bg |
2050 background |
Scenario E: Table 4-4 |
| 2050ss |
2050 including subsonics |
Scenario F: Table 4-4 |
| 2050hf |
2050 subsonic/supersonic hybrid fleet |
Scenario S9h: Table 4-12 |
| 1970bg |
1970 background |
Deduced from 1992bg |
| 1970ss |
1970 subsonic |
Deduced from 1992ss |
|
|
|

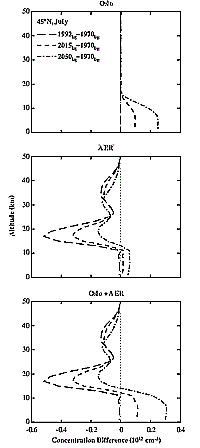
Figure 5-4: Method used to combine 3-D CTM and 2-D CTM
results for changes in background atmospheres.
|
These absolute differences are applied to 1992ss to produce 1992bg, the 1992
background atmosphere, which is free of inputs from aircraft emissions. A model
calculation is then carried out using the prescribed background scenario for
2015. The results of these calculations are compared with the similar calculation
for 1992, and the absolute difference obtained from the model calculations is
applied to 1992bg to obtain 2015bg, the 2015 background atmosphere. Comparison
of a model calculation for a 2015 atmosphere that contains inputs attributable
to aviation, assuming only subsonic aircraft will be operating, with the model
calculation for the 2015 background atmosphere provides an estimate of absolute
changes in ozone concentration between these two calculations. These differences
are applied to 2015bg to produce 2015ss, the 2015 atmosphere that includes the
effects of emissions from a purely subsonic fleet of aircraft. Clearly, an analogous
approach can be adopted to obtain the required information for 2050 and for
1970. Chapter 4 has provided mixing ratio differences
calculated for the impact of aviation on ozone profiles for the latitudes and
seasons shown in Table 5-1. The authors of Chapter
4 chose results from the Oslo 3-D model and the Atmospheric and Environmental
Research, Inc. (AER) 2-D model as representative of the subsonic and supersonic
scenario calculations, respectively. Table 5-2 shows
the scenarios considered here, with references to the relevant Chapter
4 tables. The method adopted in Chapter 4 for expressing
the range in uncertainties for the ozone mixing ratio differences is discussed
in Section 5.4.2.3. Figure 5-3
attempts to highlight the fact that, although 1992bg, 2015bg, and 2015ss are
derived from model calculations, they have the measurements of 1992ss as a reference.
The implication of this approach is that, although ozone concentrations derived
from models clearly have uncertainties, the differences obtained between any
two model calculations may be more accurate than the absolute concentrations
in either model calculation. This assumption is questionable and must be regarded
more as an assumption that allows UV calculations to proceed than one that can
be defended strongly. The approach does have the advantage that UV calculations
derived from 1992bg, 2015bg, and 2015ss are not based entirely on model calculations.
It should be noted that, in assigning differences between model calculations
to measured values in 1992ss, absolute differences in model calculations have
been chosen rather than percentage differences. Again, the approach taken cannot
be defended rigorously. Examination of the 3-D CTM results in Chapter
4 shows a very wide variation in the range of models for estimated ozone
differences in the upper troposphere. Arguments can be advanced for adopting
either absolute or percentage changes to apply to measured ozone columns; until
the reasons for the variations in the range of models are clear, however, neither
approach is clearly superior to the other.
The current limitations of multidimensional CTMs generate additional complications
that must be addressed in assessing the impacts of aviation on the composition
of the atmosphere. The impact of subsonic fleets on ozone, for the present and
for 2015 and 2050, has been discussed in Chapter 4, based
on a range of 3-D CTMs. In their present state, these predominantly tropospheric
models are unable to take into account adequately changes in the chemistry of
the stratosphere. Between 1992 and 2050, for example, these changes would be
induced predominantly by changes in the concentrations of inorganic chlorine
and bromine compounds in the stratosphere. If the principal concern were to
evaluate the impact of aviation on ozone for a given year, these limitations
would not be too severe. However, if in addition one wishes to compare the effects
of aircraft emissions with those that can be attributed to changes in stratospheric
processes over the period 1970 to 2050, then one requires more information than
current 3-D CTMs can supply. Furthermore, it is expected that future fleets
may contain a supersonic component. These supersonic aircraft will fly in the
stratosphere; to calculate the effects of this hybrid subsonic/supersonic fleet,
models capable of assessing stratospheric changes must be used.
Calculations of the effects of the hybrid subsonic/supersonic fleets were carried
out in Chapter 4 in the following way. For a given year
(2015 for example), a 3-D CTM calculation using the Oslo model was performed
to determine the change in ozone concentration for the subsonic fleet relative
to the background atmosphere for that year. A 2-D calculation was then carried
out with the AER 2-D model to determine the change in mixing ratio for ozone
between the hybrid fleet and subsonic-only fleet scenarios. For the latitudes
and seasons shown in Table 5-1, these mixing ratio
differences were added to the mixing ratio differences, calculated by the Oslo
3-D CTM, between the subsonic fleet and the background atmosphere. The scenarios
used in Chapter 4 to provide the ozone differences for
the subsonic impact were (A,B, 1992), (C,D, 2015), and (E,F, 2050), as defined
in Table 4-4. The hybrid fleet impacts were obtained
by comparing scenario S1k, defined in Table 4-11,
with scenario D of Table 4-10 for 2015 and scenario
S9h, defined in Table 4-11, with scenario D9 from
Table 4-10 for 2050. Results from these sets of
scenarios correspond to the calculated impacts of 500 HSCTs in 2015 and 1,000
HSCTs in 2050.
|

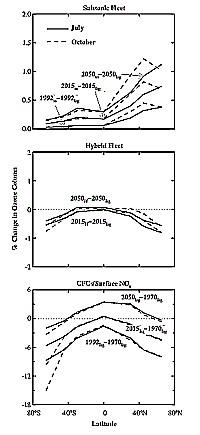
Figure 5-5: Ozone column changes for July and October.
|
Calculations designed to show the effects of aviation relative to changes in
ozone or UV resulting from changes in the composition of the stratosphere require
a slightly more convoluted approach. This approach is illustrated in Figure
5-4. The top panel shows the differences in background atmospheres calculated
by the Oslo 3-D CTM for the years 2050 and 1970 (2050bg-1970bg),
2015 and 1970 (2015bg-1970bg), and 1992 and 1970 (1992bg-1970bg).
The middle panel shows the results obtained when these calculations are performed
with the AER 2-D CTM. The background surface concentrations used in these calculations
for 1992, 2015, and 2050 are those shown in Table 4-8.
The background surface concentrations used for the 1970 calculation are those
given in Table 6.3 of WMO (1994). It is clear from
the top panel that the 3-D CTM does not provide any information about changes
occurring in the atmosphere above about 18 km for the period from 1970 to 2050.
The calculated increases for ozone shown below 18 km and
reaching peak values in the lower troposphere result from increased surface
emissions, predominantly NOx, that are expected to occur over this time period.
The calculations reported in the middle panel show quite different behavior.
In this set of 2-D calculations, surface emissions of NOx were not increased
between 1970 and 2050. The changes in ozone concentrations shown in this panel
are directly attributable to expected changes in concentrations of inorganic
chlorine and bromine compounds, as well as those for nitrous oxide.
The bottom panel in Figure 5-4 shows the result of
the linear combination of the concentration changes calculated in the top and
middle panels. Results such as those in the bottom panel are then used to derive
the background atmospheres for 1970, 2015, and 2050 from the background atmosphere
used for 1992. The procedure of combining the results of 3-D and 2-D CTM calculations
in this manner is clearly questionable, but at the present stage of model development
this compromise is necessary.
5.4.1.2. Method for Referring Calculated Changes to
1970
As discussed elsewhere in this chapter, the calculated impact of aviation on
UV is to be compared with impacts on UV resulting from changes in atmospheric
composition from other sources. For this purpose, 1970 has been taken as the
reference year because it represents a period before the expected onset of substantial
changes in the concentration of stratospheric ozone resulting from increases
in the concentrations of stratospheric chlorine and bromine. The required ozone
columns for 1970 have been obtained in the following manner: It is assumed that
the amount of ozone in the lower troposphere of the background atmosphere has
not changed between 1970 and 1992. Just as for 2015 and 2050, a 2-D calculation
is performed to derive the 1970 background columns from corresponding values
for 1992. As explained in Section 5.4.1.1, the background
surface concentrations used for the 1970 calculation are those given in Table
6.3 of WMO (1994). It is further assumed that changes in tropospheric ozone
due to aviation between 1970 and 1992 are proportional to the amount of NOx
emitted. The amount of NOx emitted by aviation in 1970 is deduced from a linear
extrapolation of the values given in Table 9-4; this
amount is estimated to be 0.72 Tg.
|