4. What are the Current and Future Impacts of Subsonic Aviation on Radiative
Forcing and UV Radiation?
|

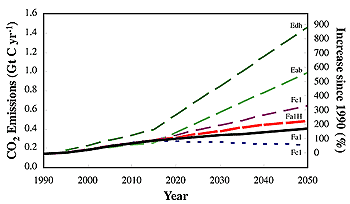
Figure 1: Total aviation carbon dioxide emissions
resulting from six different scenarios for aircraft fuel
use. Emissions are given in Gt C [or billion (109)
tonnes of carbon] per year. To convert Gt C to Gt
CO2 multiply by 3.67. The scale on the righthand axis
represents the percentage growth from 1990 to 2050.
Aircraft emissions of carbon dioxide represent 2.4%
of total fossil fuel emissions of carbon dioxide in 1992
or 2% of total anthropogenic carbon dioxide
emissions. (Note: Fa2 has not been drawn because the
difference from scenario Fa1 would not be discernible
on the figure.)
|
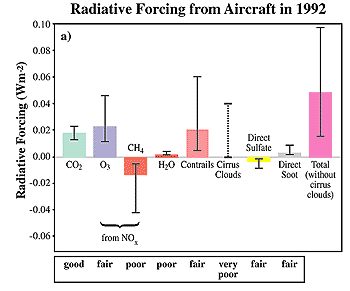
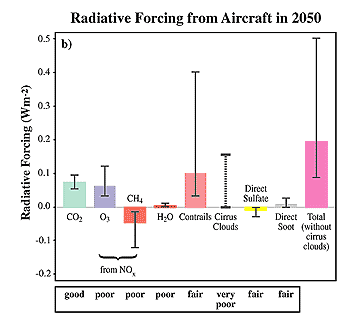
The summary of radiative effects resulting from aircraft engine emissions is
given in Figures 2 and 3.
As shown in Figure 2, the uncertainty associated
with several of these effects is large.
4.1. Carbon Dioxide
Emissions of carbon dioxide by aircraft were 0.14 Gt C/year in 1992. This
is about 2% of total anthropogenic carbon dioxide emissions in 1992 or about
13% of carbon dioxide emissions from all transportation sources. The range of
scenarios considered here projects that aircraft emissions of carbon dioxide
will continue to grow and by 2050 will be 0.23 to 1.45 Gt C/year. For the reference
scenario (Fa1) this emission increases 3-fold by 2050 to 0.40 Gt C/year, or
3% of the projected total anthropogenic carbon dioxide emissions relative to
the mid-range IPCC emission scenario (IS92a). For the range of scenarios, the
range of increase in carbon dioxide emissions to 2050 would be 1.6 to 10 times
the value in 1992.
Concentrations of and radiative forcing from carbon dioxide today are those
resulting from emissions during the last 100 years or so. The carbon dioxide
concentration attributable to aviation in the 1992 atmosphere is 1 ppmv, a little
more than 1% of the total anthropogenic increase. This percentage is lower than
the percentage for emissions (2%) because the emissions occurred only in the
last 50 years. For the range of scenarios in Figure 1, the accumulation of atmospheric
carbon dioxide due to aircraft over the next 50 years is projected to increase
to 5 to 13 ppmv. For the reference scenario (Fa1) this is 4% of that from all
human activities assuming the mid-range IPCC scenario (IS92a).
4.2. Ozone
The NOx emissions from subsonic aircraft in 1992 are estimated to have increased
ozone concentrations at cruise altitudes in northern mid-latitudes by up to
6%, compared to an atmosphere without aircraft emissions. This ozone increase
is projected to rise to about 13% by 2050 in the reference scenario (Fa1). The
impact on ozone concentrations in other regions of the world is substantially
less. These increases will, on average, tend to warm the surface of the Earth.
Aircraft emissions of NOx are more effective at producing ozone in the upper
troposphere than an equivalent amount of emission at the surface. Also increases
in ozone in the upper troposphere are more effective at increasing radiative
forcing than increases at lower altitudes. Due to these increases the calculated
total ozone column in northern mid-latitudes is projected to grow by approximately
0.4 and 1.2% in 1992 and 2050, respectively. However, aircraft sulfur and water
emissions in the
stratosphere tend to deplete ozone, partially offsetting the NOx-induced ozone
increases. The degree to which this occurs is, as yet, not quantified. Therefore,
the impact of subsonic aircraft emissions on stratospheric ozone requires further
evaluation. The largest increases in ozone concentration due to aircraft emissions
are calculated to occur near the tropopause where natural variability is high.
Such changes are not apparent from observations at this time.
4.3. Methane
In addition to increasing tropospheric ozone concentrations, aircraft NOx
emissions are expected to decrease the concentration of methane, which is also
a greenhouse gas. These reductions in methane tend to cool the surface of the
Earth. The methane concentration in 1992 is estimated here to be about 2% less
than that in an atmosphere without aircraft.
This aircraft-induced reduction of methane concentration is much smaller than
the observed overall 2.5-fold increase since pre-industrial times. Uncertainties
in the sources and sinks of methane preclude testing the impact of aviation
on methane concentrations with atmospheric observations. In the reference scenario
(Fa1) methane would be about 5% less than that calculated for a 2050 atmosphere
without aircraft.
Changes in tropospheric ozone are mainly in the Northern Hemisphere, while
those of methane are global in extent so that, even though the global average
radiative forcings are of similar magnitude and opposite in sign, the latitudinal
structure of the forcing is different so that the net regional radiative effects
do not cancel.
|


|
Figure 2: Estimates of the globally and
annually averaged radiative forcing (Wm-2) (see Footnote 4) from subsonic
aircraft emissions in 1992 (2a) and in 2050 for scenario Fa1 (2b). The scale
in Figure 2b is greater than the scale in 2a by about a factor of 4. The
bars indicate the best estimate of forcing while the line associated with
each bar is a two-thirds uncertainty range developed using the best knowledge
and tools available at the present time. (The two-thirds uncertainty range
means that there is a 67% probability that the true value falls within this
range.) The available information on cirrus clouds is insufficient to determine
either a best estimate or an uncertainty range; the dashed line indicates
a range of possible best estimates. The estimate for total forcing does
not include the effect of changes in cirrus cloudiness. The uncertainty
estimate for the total radiative forcing (without additional cirrus) is
calculated as the square root of the sums of the squares of the upper and
lower ranges for the individual components. The evaluations below the graph
("good," "fair," "poor," "very poor") are a relative appraisal associated
with each component and indicates the level of scientific understanding.
It is based on the amount of evidence available to support the best estimate
and its uncertainty, the degree of consensus in the scientific literature,
and the scope of the analysis. This evaluation is separate from the evaluation
of uncertainty range represented by the lines associated with each bar.
This method of presentation is different and more meaningful than the confidence
level presented in similar graphs from Climate Change 1995: The Science
of Climate Change. |
|