|
5.4.2. Results
5.4.2.1. Ozone Column Changes
|

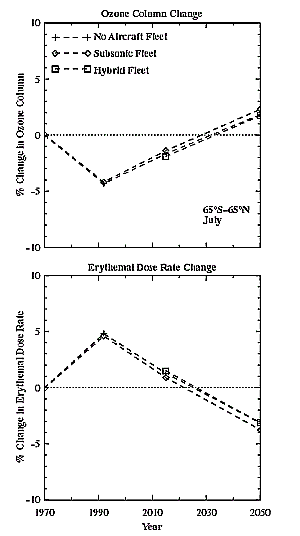
Figure 5-6: Calculated ozone and UVery averaged between 65°S and 65°N
for July and referred to the calculated background values for 1970.
|
|

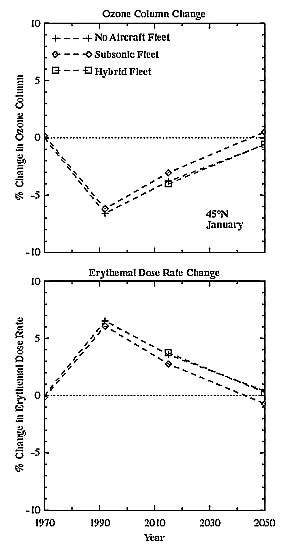
Figure 5-7: Calculated ozone and UVery at 45°N in January referred to
the calculated background values for 1970.
|
|

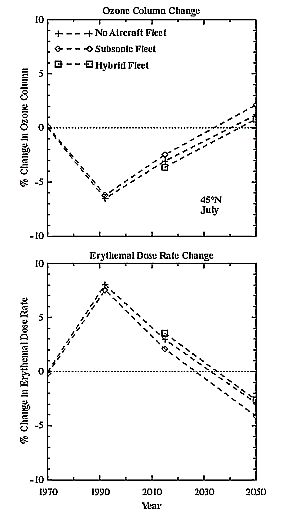
Figure 5-8: Calculated ozone and UVery at 45°N in July referred
to the calculated background values for 1970.
|
|

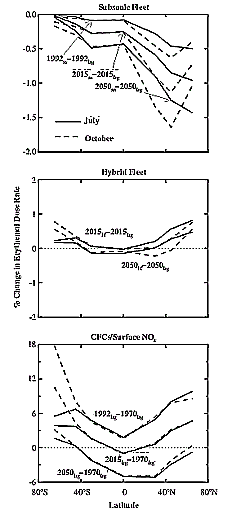
Figure 5-9: Percent changes in UVery as a function of latitude
for July and October for a number of scenarios.
|
Figure 5-5 shows calculated ozone column changes as
a function of latitude for July and October and for a range of scenarios. The
top panel shows the change in columns attributable to subsonic fleets over the
period 1992-2050 relative to a background atmosphere of the same year. The corresponding
calculations for 1970 are not shown, but the effects attributable to aircraft
for this period were very much smaller than any shown in the top panel of Figure
5-5 (see Figures 5-6, 5-7,
and 5-8). The middle panel shows a corresponding calculation
for the hybrid (subsonic+supersonic) fleets for 2015 and 2050, and the bottom
panel shows the changes in background between 2050 and 1970, between 2015 and
1970, and between 1992 and 1970. The major features of the aircraft impact on
ozone have been discussed in Chapter 4. For the background
atmospheres (bottom panel), the calculations predict a systematic increase in
ozone after 1992. For the Southern Hemisphere, this outcome is largely because
of the expected decrease in bromine and chlorine. The additional increase in
ozone in the Northern Hemisphere relative to the Southern Hemisphere is because
the projected release of NOx at the surface is greater in the Northern Hemisphere.
5.4.2.2. Calculated Changes in Ozone Compared to Changes
in UV
An alternative to the method of presentation of results used in Figure
5-5 is to show the evolution of changes in ozone and UV as a function of
time, as in Figure 5-6. Here, calculated ozone and
UVery averaged between 65°S and 65°N for July and for a range of scenarios are
referred to calculated background values for 1970. When averages are taken over
a broad latitude band such as that in Figure 5-6, seasonal
behavior is removed, to a large extent. However, a particular latitude may exhibit
significant seasonal behavior in the calculated departure from background values
for 1970. For example, Figure 5-7 shows calculated
changes for 45°N for January, and Figure 5-8 shows
the corresponding calculations for July. Comparison of Figures 5-7
and 5-8 shows that, although the calculated ozone and
UVery for the background in 2050 for January are little different from the corresponding
values for 1970, there are significant departures in July. This result is almost
certainly because of the increased ozone calculated for the upper troposphere
in 2050 resulting from the increase in NOx released from the surface of the
Earth relative to 1970.
The method of presentation shown in Figures 5-6, 5-7,
and 5-8 has the advantage that the predicted impact
of either the hybrid fleet or the subsonic fleet on the background atmosphere
at the corresponding time can easily be determined from the diagram; in addition,
the departure for any of the scenarios from the calculated value for the background
atmosphere in 1970 is readily determined. However, this method of presentation
does not show changes as a function of latitude; that information is provided
in Figure 5-9, which shows percentage UVery changes
for July and October corresponding to ozone changes in Figure
5-5. The labels on the diagram refer to the atmospheres defined in Table
5-2.
The three panels in Figure 5-9 show the calculated
changes in UVery for subsonics (top), subsonics+supersonics (middle), and changes
in ground emissions (bottom). Several trends are clear from Figure
5-9. First, the impact of subsonic aviation is significantly greater in
2015 and 2050 than in 1992 (top panel); at northern mid-latitudes, the impact
of the subsonic fleet is roughly proportional to the levels of aircraft emissions
assumed. Second, when the effect of the hybrid fleet is compared to the corresponding
background, there is an increase in UVery relative to the case where a pure
subsonic fleet is considered (compare the top and middle panels). Third, calculated
changes in UVery relative to 1970 for present and future background atmospheres
show an increase in 1992 and a systematic decrease thereafter (bottom panel).
This behavior is directly related to the levels of bromine and chlorine assumed
for the stratosphere and the amount of NOx assumed to be released from the surface
of the Earth.
5.4.2.3. Treatment of Uncertainties in Ozone Change
and UVery Change Calculations
The calculations reported in Sections 5.4.2.1 and
5.4.2.2 are based on information provided in Chapter
4. In that chapter, calculations were carried out for a number of scenarios
corresponding to the years 1992, 2015, and 2050. For 1992, the calculated impact
of the subsonic fleet on atmospheric ozone was estimated using a 3-D CTM. Similar
calculations were performed to assess the expected impact of subsonic aircraft
in 2015 and 2050. In addition, the impact of hybrid fleets of subsonic and supersonic
aircraft for 2015 and 2050 were obtained using a combination of 2-D and 3-D
chemical transport calculations. The results for the hybrid fleet in Sections
5.4.2.1 and 5.4.2.2 are
based on calculations provided in Chapter 4 for the AER
model for scenarios S1k-D for 2015 and S9h-D9 for 2050. These scenarios are
defined in Tables 4-10, 4-11,
and 4-12. In addition to performing these calculations,
the authors of Chapter 4 set uncertainty limits on these
results. For ozone changes resulting from the impact of the subsonic fleets,
the uncertainty was taken to be a factor of two times the difference obtained
by the Oslo 3-D model for scenarios (B-A), (D-C), and (F-E) defined in Table
4-4. The quoted uncertainties are taken as the 67% likelihood range. We
believe that uncertainty in the calculation of ozone percentage changes is by
far the greatest uncertainty in the determination of percentage changes in UVery;
accordingly, we have not added additional uncertainties to the range supplied
by Chapter 4. In addition, our assessment of the confidence
in these calculations is as given by Chapter 4-that is,
"fair" for 2015 and "poor" for 2050.
Chapter 4 considered three components in assessing the
uncertainty for the impact of the hybrid fleet on ozone: The spread obtained
by a number of models for a range of plausible scenarios, uncertainties in chemical
rate coefficients, and uncertainties introduced by inaccurate treatment of atmospheric
circulation in the models. Chapter 4 concluded that the
annually averaged impact on ozone for the Northern Hemisphere of a hybrid fleet
in 2050 (including 1,000 HSCTs) would be in the range of -3.5 to +1% when compared
with the impact of the subsonic fleet and that the best estimate is-1% given
by the AER 2-D model. The uncertainty range again represents the 67% likelihood
range with a confidence in this
uncertainty range of "fair." As with estimated subsonic impacts, we believe
that the uncertainty in the change in ozone caused by the hybrid fleet is much
greater than any other uncertainties in the calculation of changes in UVery.
Chapter 4 has provided only an annually averaged Northern
Hemisphere value because it is not possible at present to assign uncertainty
factors as functions of latitude, altitude, and season. The large variations
in ozone changes predicted by a range of models as functions of latitude, altitude,
and season (see Figures 4-6c, 4-6d,
4-12a, and 4-12b) are clear
indications of shortcomings inherent in current models.
Given that the predicted change in UVery is primarily a function of changes
in the ozone column and is less sensitive to the exact altitude dependence of
the ozone change, an estimate of the uncertainty for changes in ozone columns
as a function of latitude and season should be sufficient. This chapter uses
the subjective estimates of uncertainties from Chapter 4 and
defines the 67% likelihood range for changes in ozone columns at each latitude
and season as follows. If the column change predicted by the AER 2-D model at
latitude (Q) and time of year (T) is a(Q,T)%, the uncertainty range in percent
column ozone change at that latitude and time of year is given by [a(Q,T) -3]%
to [a(Q,T) +2]%. The same definition will be adopted for fleet sizes of either
500 or 1,000 HSCTs. These estimates are very subjective; although the confidence
attached to these uncertainties for the tropics is "good," outside the tropics
the confidence can be considered only "fair." In the absence of a rigorous method
of obtaining uncertainties, this chapter also assumes that there is a 5% range
in estimated uncertainties for change in UVery; this range is given by [b(Q,T)
-2]% to [b(Q,T) +3]%, where b(Q,T)% is the percent change in UVery corresponding
to a(Q,T)% change in ozone column. In summary, uncertainties in the impact of
the subsonic fleet on UVery may be obtained from any of the diagrams in this
chapter that report this change simply by doubling or halving the change shown
in the diagram. For example, in the top panel of Figure
5-9, the change in UVery shown for the subsonic impact for July of 2015
at 45°N is -0.9%. Accordingly, the 67% likelihood range for this particular
change is-1.8 to -0.5%; because it is a calculation for 2050, our confidence
in this result is "poor" as prescribed by Chapter 4. Similarly,
in the middle panel of Figure 5-9, the impact of the
hybrid fleet at the equator in July of 2050 is shown as -0.2%. This impact is
based on a calculation of ozone changes by the AER 2-D model. From the discussion
above, we determined the 67% likelihood range for this impact to be -2.2 to
+2.8%, and our estimate of the confidence is "good." At 65°N in July of 2050
(middle panel of Figure 5-9), the calculated impact
of the hybrid fleet on UVery is +0.5%, which gives-1.5 to +3.5% as the 67%
likelihood range with an estimated confidence of "fair."
As discussed in Section 5.4.1.1, the calculations
shown in Figures 5-6 to 5-9
include percent changes in UVery for the background atmosphere using 1970 as
the reference year. At 45°N in July, these changes are +8, +3, and -3% for 1992,
2015, and 2050, respectively. At 45°S in January, the calculated changes are
+9, +4.5, and 0% for 1992, 2015, and 2050, respectively. For comparison, the
computed change due to observed ozone depletion at 35-50°N in July is about
4% over the period 1970-1992 (WMO, 1999). The corresponding change for 35-50°S
in January is 8%.
5.4.2.4. Contribution of Persistent Contrails, Cirrus
Clouds, and Aerosols to the Impact of Aviation on UV
The geographic and temporal variability associated with clouds and aerosols
complicates attempts to make general statements concerning their effects on
UV irradiance. Nonetheless, this section considers some highly simplified scenarios
to place bounds on the influence of altered contrails, cirrus, and aerosol amounts.
There are three issues to address: The effect of regional, persistent contrails;
the effect of observed trends in cirrus that may result from a variety of processes,
including aviation; and the effect of aviation-produced aerosols.
To estimate the effects of persistent contrails on ground-level UV, calculations
assume a 5% area coverage, appropriate to the local maximum over the eastern
United States of America (see Section 3.4.3), and
a contrail optical thickness of 0.3. For latitude 45°N summer, local noon, this
scenario leads to a reduction in UVery of 0.2% relative to clear skies. If persistent
contrail coverage were to increase to 10%, the corresponding reduction in UVery
would be 0.4%.
The observed trends in cirrus presented in Chapter 3
include the effects of aviation, as well as any other influences that may be
operative. The estimated response of UVery to trends in the cirrus background
is based on the following assumptions: The cirrus have a scattering optical
thickness of 0.3, and initially 23% of the land area is covered by cirrus at
an altitude of 11 km. Starting from this condition, an increase of 3.5% per
decade in the land area covered by cirrus, appropriate to the United States
of America in spring (Figure 3-19), leads to a decline
in UVery of approximately 0.1% per decade for local noon at latitude 45°N. If
changes in persistent contrails and cirrus, especially on regional scales, differ
substantially from the estimates adopted above, the resulting changes in UVery
would have to be modified accordingly. The numbers given here point to the magnitude
of reasonable changes, but they should not be viewed as predictions of the future.
The aircraft-related perturbation to atmospheric optical depth in the UV from
soot and sulfate aerosols is very small compared to the natural background opacity.
The values presented in Table 3-4 imply enhanced
aerosol optical depths for soot and sulfates of less than 10-3. The decrease
in UVery associated with such perturbations is less than 0.1%. Calculations
indicate that, although an increase in aerosols in the background atmosphere
between 1970 and 2050 from sources other than aviation would result in a reduction
of UVery relative to clear skies, the percent change in UVery attributable to
aviation is relatively insensitive to background aerosol loading.
|