|
6.5.2. Climate Signatures of Aircraft-Induced Ozone Perturbations
|

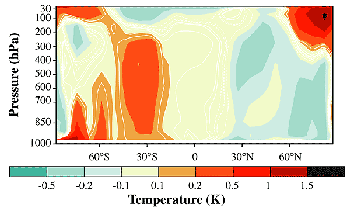
Figure 6-11: Equilibrium change of annual, zonal
mean temperature (K) caused by ozone perturbation
due to NOx emissions of a projected sub- and
supersonic aircraft fleet for the year 2015, as
simulated with the GISS model (Rind and Lonergan,
1995). This calculation is not for any specific
scenarios assessed here.

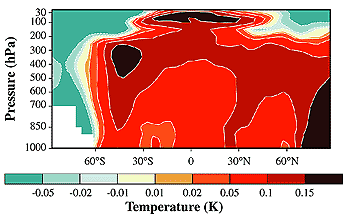
Figure 6-12: Equilibrium change of annual, zonal
mean temperature (K) caused by ozone perturbation
due to NOx emissions of 1991-92 air traffic (DLR-2),
as simulated with the ECHAM4/MLO model (Ponater
et al., 1998). This result is similar to, but not based on,
the scenarios analyzed here.
|
|

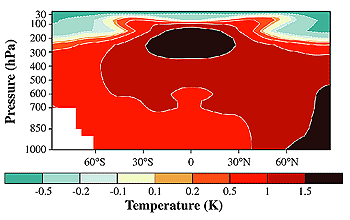
Figure 6-13: Equilibrium change of annual, zonal
mean temperature (K) resulting from the
anthropogenic increase of well-mixed greenhouse
gases from 1990 to 2015, as simulated with the
ECHAM4/MLO model (Ponater et al., 1998).
|
With uncertainty in relating RF to climate response noted above, it would be
useful to compare CGCM-modeled climate responses for aircraft perturbations.
Less agreement is expected between models because the magnitude of their feedback
responses (i.e., climate sensitivity) can be quite different from one another.
A review of different model sensitivities has been given in IPCC (1990, 1992,
1996); the values vary from a sensitivity of about 0.4 K/(Wm-2)
to 1.2 K/(Wm-2) for doubled CO2.
How the sensitivity would vary for heterogeneous aircraft perturbations is not
known.
The most appropriate tool would be simulations in the transient mode using
coupled atmosphere-ocean GCMs. These simulations are computationally very expensive,
and it would be very difficult to separate signal from noise. To date, however,
all known comprehensive model simulations of aircraft induced climate change
were made in the quasi-stationary mode using either pure atmospheric GCMs (e.g.,
Sausen et al., 1997) or atmospheric GCMs coupled to mixed layer ocean models
(examples below). In other words, these simulations studied quasi-equilibrium
response to a stationary or seasonally repeating perturbation. Pure atmospheric
models underestimate the response if, for instance, sea surface temperature
is fixed to a prescribed value. Equilibrium simulations with coupled models
overestimate the aircraft effect in absolute numbers relative to transient simulations
(see discussion in Sausen and Schumann, 1999), and the spatial pattern of climate
change can serve only as a first estimate (Kattenberg et al., 1996). These simulations
must be compared with analogous simulations for well-mixed greenhouse gases
(e.g., CO2 doubling). Then the particular climate sensitivity
to aircraft-induced radiative forcing and aircraft signatures of climate changes
may possibly be extracted.
Using the GISS 3-D climate/middle atmosphere model, Rind and Lonergan (1995)
studied the impact of the combined effect of a stratospheric ozone decrease
and a tropospheric ozone increase from an assumed sub- and supersonic aircraft
fleet for the year 2015. An equilibrium climate simulation leads to a general
stratospheric cooling of a few tenths of a Kelvin, combined with a warming of
the lower stratosphere in northern polar regions as a result of altered atmospheric
circulation (Figure 6-11). The globally averaged
surface temperature change was found to be not statistically significant compared
with climatic variability.
As another example, Figure 6-12 shows the equilibrium
annual, zonal mean temperature change from ECHAM4/MLO (Ponater et al., 1998)
due to ozone perturbations resulting from 1992 air traffic (Dameris et al.,
1998), which differ slightly from the 1992 ozone perturbations reported in this
assessment. The overall pattern of temperature change is statistically significant.
The RF associated with this case is 0.04 W m-2, and the
resulting equilibrium change of global mean surface temperature is 0.06 K, resulting
in a climate sensitivity parameter l of about 1.5 K/(W m-2).
Note that a climate sensitivity calculated for such small perturbations is associated
with large uncertainty.
For comparison, Figure 6-13 shows the equilibrium
climate change associated with the anthropogenic increase of well-mixed greenhouse
gases CO2, CH4, etc.) from 1990
to 2015 according to IS92a as simulated with the same model. The associated
global mean surface temperature change is 0.9 K, and the RF is 1.1 W m-2. The
resulting climate sensitivity parameter, about 0.8 K/(W m-2),
is smaller than for the aircraft-induced ozone perturbation. Temperature change
patterns are quite different for well-mixed greenhouse gases than for the aircraft-induced
ozone perturbation.
These and related experiments with the GISS and ECHAM4 models showed that:
The aircraft-related climate change pattern and the aircraft-related climate
sensitivity parameters are model-dependent, and the climate response for aircraft-induced
ozone changes is different from that for conventional greenhouse gases. Internal
feedback processes within and between climate models appear to work differently.
The exact nature of the climate feedback differences to different pattern of
RF remains to be investigated. Thus, the climate factors of human interest,
especially the regional climate change for these regional perturbations, await
further development of climate models. The details of the climate response to
the contrail radiative imbalance, which is spatially heterogeneous on the smallest
scales, is likewise unknown.
|