|
5.4.1. Methane
|

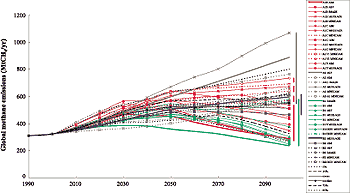
Figure 5-5: Standardized global CH4 emissions
for SRES scenarios, classified into four scenario families (each denoted
by a different color code - A1, red; A2, brown; B1, green; B2, blue).
Marker scenarios are shown with thick lines without ticks, globally harmonized
scenarios with thin lines, and non-harmonized scenarios with thin, dotted
lines (see Table 4-3). Black lines show percentiles,
means, and medians for the SRES scenarios. For numbers on the two additional
illustrative scenarios A1FI and A1T see Appendix
VII.
|
In the IPCC WGI SAR, anthropogenic CH4 emissions in the year 1990 were estimated
at 375 ± 75 MtCH4 (Houghton et al., 1996) and are shown in Table
5-3. These emissions arise from a variety of activities, dominated by biogenic
processes that are often subject to considerable uncertainties (see Chapter
3). CH4 emissions across the six models used to generate the SRES scenarios
for 1990 range between 298 and 337 MtCH4 . After standardization (see Box
5-1), the base-year emissions in the SRES scenarios were set to 310 MtCH4 , within the range mentioned above. About one-quarter of the total emissions
are related to fossil fuel extraction (CH4 emissions from coal mines, CH4 venting
from oil extraction), transport and distribution (e.g., leakage from pipelines),
and consumption (incomplete combustion). The biogenic sources include agriculture
(enteric fermentation, rice paddies, and animal waste), biomass burning, and
waste management (landfills, sewage). Based on this source list, future CH4
emission trajectories depend upon such variables as volumes of fossil fuels
used in the scenarios, regional demographic and affluence developments, and
assumptions on preferred diets and agricultural practices.
Results from the 40 SRES scenarios indicate that uncertainties surrounding
future CH4 emission levels are likely to increase over time (Figure
5-5). By 2050 the range across all scenarios is between 359 and 671 MtCH4
, and the range increases further to levels between 236 and 1069 MtCH4 by 2100.
This wide range in the SRES emissions reflects new information and additional
uncertainties concerning certain source categories such as sewage systems. As
for CO2 emissions related to land use (see Section 5.3.2),
at least one scenario from all four SRES scenario families falls within the
25th and 75th percentiles of the emission range. Thus, very different future
developments in energy and agricultural systems could lead to similar outcomes
in terms of global CH4 emissions, even if the source categories and regional
patterns of these emissions are very different. At the same time, the uncertainty
range for any given scenario family is also substantial, as indicated by the
range of 2100 emissions for the A1, A2, and B1 scenario families in Figure
5-5.
The subsequent sections discuss CH4 emission trajectories for individual scenario
families, with sectoral and regional patterns described on the basis of the
output of marker scenarios.
|