5.5. Aerosols and Ozone Precursors
In addition to the GHGs discussed above, aerosol particles and tropospheric
ozone also change the radiative balance of the atmosphere, albeit in a spatially
heterogeneous manner. Sulfate aerosol particles, which form as a consequence
of SO2 emissions, act as a cooling agent. Their net effect is quite uncertain,
but is thought to offset the forcing from all non-CO2 GHGs to date (Houghton
et al., 1996). As interest in the role of sulfur has increased the since the
previous IPCC assessment, and to encapsulate recent trends and expectations,
sulfur emissions are discussed here in substantial detail. Nitrates, ammonia,
organic compounds, and black carbon also contribute to the formation of atmospheric
aerosols. Carbonaceous aerosols exert a small positive forcing effect, while
the effects of other compounds and aerosols are less clear. Tropospheric ozone
is a GHG also, with a small net positive forcing effect. Future tropospheric
ozone levels will be determined by emissions of CH4, CO, NOx , and NMVOCs. The
last three groups are reported and discussed here in a more aggregated and stylized
form only, because these gases are short lived, their potential to form ozone
is highly non-linear; NMVOCs are not distinguished by their reactivity, and
data problems associated with including key sources in aggregated long-term
models are large.
5.5.1. Ozone Precursors: Nitrogen Oxides, Non-Methane Volatile Organic Compounds,
and Carbon Monoxide
5.5.1.1. Nitrogen Oxides
Emissions of NOx primarily result from the combustion of fossil fuels. The
NOx concentration in exhaust gases depends on combustion conditions (temperature,
residence time, air-to-fuel ratio, mixing) and varies widely across different
applications. In particular, internal combustion engines used in road vehicles
and ships have very high emissions, although new designs and exhaust-gas treatment
offer much lower specific emission levels. Recent research (Davidson and Kingerlee,
1997; Delmas et al., 1997; Mosier et al., 1998) indicates that soil may be a
significant source of NOx emissions also. This source, however, is not included
in the models used in the current report.
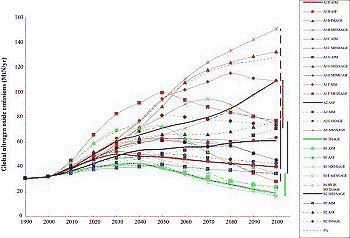
The 1990 NOx emissions in the six SRES models range between 26.5 and 34.2 MtN,
but not all the models provide a comprehensive description of NOx emissions.
Some models do not estimate NOx emissions at all (MARIA, MiniCAM8),
whereas others only include energy-related sources (MESSAGE) and have adopted
other source categories from corresponding model runs derived from other models
(i.e. AIM). Standardized (see Box 5-1 on Standardization)
1990 NOx emissions in the SRES scenarios, measured as nitrogen, amount to 31
MtN (Figure 5-9).
|

Figure 5-9: Standardized global NOx emissions
in SRES scenarios, classified into four scenario families (each denoted
by a different color code - A1, red; A2, brown; B1, green; B2, blue).
Marker scenarios are shown with thick lines without ticks, globally harmonized
scenarios with thin lines, and non-harmonized scenarios with thin, dotted
lines (see Table 4-3). Black lines show percentiles,
means, and medians for SRES scenarios. For numbers on the two additional
illustrative scenarios A1FI and A1T see Appendix VII.
|
As mentioned in Chapter 4, the volume of fossil fuels
used for various energy purposes varies widely in the SRES scenario families.
In addition, the level and timing of emission controls, inspired by local air
quality concerns, is assumed to differ. As a result the spread is largest within
the A1 scenario family, in which it is almost as large as the range across all
40 SRES scenarios. Up to the 2020s, all scenarios project rising NOx emissions
(Figure 5-9). The 25th and 75th percentile emissions corridor spans between
40 and 60 MtN by the 2020s, which can be interpreted as a "central tendency"
among the entire spectrum of the 40 SRES scenarios. Beyond 2030, uncertainties
in emission levels increase significantly. By 2100, the SRES range is between
16 and 150 MtN (i.e. emissions decrease by a factor of two or increase by a
factor of five compared with 1990 levels). The median and mean emissions are
tracked by a number of scenarios, most notably by B2- MESSAGE (B2 family marker)
and A1B-IMAGE. In these scenarios, NOx emissions tend to increase up to 2050
and stabilize thereafter, the result of a gradual substitution of fossil fuels
by alternatives as well as by the increasing diffusion of NOx control technologies.
Low emission futures are described by various B1 family scenarios, whereas the
upper bound for future NOx emissions is represented by scenarios of the fossil
fuel intensive A1 scenario groups (e.g. A1C- and A1G-MESSAGE) and the high population,
high fossil energy A2 scenario family (A2-ASF, A2-MESSAGE, or A2G-IMAGE) (Figure
5-9).
The fossil fuel dominated A2-ASF (A2 family marker) with limited environmental
concern has a rapidly increasing NOx trajectory (Figure 5-9). Emissions in other
A2 scenarios also continue to grow, except in A2-AIM for which emissions level
off by the last decades of the 21st century. In the A1B marker (A1B-AIM), the
emissions growth is initially about as strong as in A2-ASF, but emissions peak
in 2030, and decline as the fossil fuel share of total primary energy falls
and the remaining fossil fuel technologies become more advanced (Figure 5-9).
Scenarios from other A1 family groups that assume a much larger and continued
role of fossil fuels yield much higher NOx emissions, which reach 150 MtN by
2100 in the coal-based A1C-MESSAGE scenario. Emission growth in the B2 family
scenarios is less steep than in the A1 family, but persists throughout the entire
period, albeit at a declining rate. By 2100, emissions in the B2-MESSAGE scenario
(B2 family marker) are about twice as large as in 1990 (Figure 5-9). B2-ASF
has a similar trajectory, while the B2-AIM scenario has essentially constant
NOx emissions over the entire period. Emissions in the B1 marker (B1-IMAGE)
are among the lowest of all the 40 scenarios (Figure 5-9). In this scenario,
emissions increase stops around 2050 and subsequently declines toward the end
of the 21st century to 60% of the current level. Other scenarios within the
B1 group coincide well with the B1 marker in 2100, although the maximum emission
levels in these scenarios are much higher than in B1-IMAGE (Figure 5-9).
5.5.1.2. Non-Methane Volatile Organic Compounds

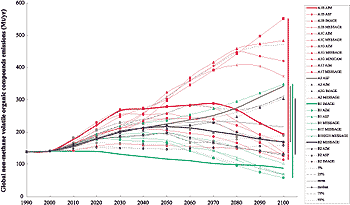
Figure 5-10: Standardized global emissions
of NMVOCs for SRES scenarios, classified into four scenario families (each
denoted by a different color code - A1, red; A2, brown; B1, green; B2,
blue). Marker scenarios are shown with thick lines without ticks, globally
harmonized scenarios with thin lines, and non-harmonized scenarios with
thin, dotted lines (see Table 4-3). Black lines
show percentiles, means, and medians for SRES scenarios. For numbers on
the two additional illustrative scenarios A1FI and A1T see Appendix
VII.
|
NMVOCs arise from fossil fuel combustion (as with NOx , wide ranges of emission
factors are typical for internal combustion engines), and also from industrial
processes, fuel storage (fugitive emissions), use of solvents (e.g., in paint
and cleaners), and a variety of other activities. As the chemical reactivities
of the various substances grouped under the NMVOCs category are very different,
so are their roles in ozone formation and the (potential) health hazards associated
with NMVOCs. In this report NMVOCs are reported as one group. In 1990, the estimated
NMVOC emissions range between 83 and 178 Mt, which after standardization (see
Box 5-1) translates into 140 Mt (Figure 5-10). As
discussed above for NOx emissions, not all models include this emissions category
or all of its sources; the most detailed treatment of NMVOC emissions is given
in the ASF model.
A relatively robust trend across all 40 scenarios (see Figure 5-10) is a gradual
increase in NMVOC emissions up to about 2050, as indicated by the 25th and 75th
percentile corridor, with the range between 190 and 260 Mt by that year. Beyond
2050, uncertainties increase with respect to both emission levels and trends.
As for NOx emissions discussed above, the upper bounds of NMVOC emissions are
formed by fossil fuel intensive scenarios within the A1 scenario family (e.g.
A1B-ASF), and the lower bounds by the scenarios within the B1 family (with an
important alternative higher scenario B1-ASF). Characteristic ranges are between
60 and 90 Mt by 2100 in the low emissions cluster and between 370 and 550 Mt
in the high emissions cluster. All other scenario families and individual scenarios
fall between these two emissions clusters, with the B2 marker scenario (B2-MESSAGE)
closely tracking the median of global NMVOC emissions from all the SRES scenarios.
In the B1 family marker (B1-IMAGE) emissions gradually decline to 60% of the
1990 level by 2100 (Figure 5-10). The B1-AIM and B1-MESSAGE trajectories are
similar, but differ somewhat from the B1 marker. They increase until the 2020s
(AIM) or even the 2050s (MESSAGE) at modest rates, but subsequently decline
to around or even below the B1 marker in 2100. The B1-ASF profile, however,
is radically different, growing faster and continuously throughout the 21st
century. By 2100, the NMVOC emissions in B1-ASF increase to 350 Mt, or 2.5 times
the 1990 level. This indicates the adoption in this scenario of fairly different
assumptions with respect to technological development and emission controls
as compared to the rest of B1 scenarios. In the A2 family marker (A2-ASF) and
B2 family marker (B2-MESSAGE), emissions grow steadily until 2050, by which
time they are around 50% higher than today. Thereafter, emissions in B2-MESSAGE
decline gradually, while in the A2 marker the growth continues to reach 2.5
times the current level by 2100 (similar to B1-ASF). Emissions in A2-MESSAGE
are fairly similar to those of the A2 marker, while emissions in A2-AIM decline
to 170 Mt by 2100, only half of the A2 marker level. The trajectory in the A1B
marker (A1B-AIM) is very distinct - up to 2060 a fast growth is observed to
more than twice the 1990 level, after which emissions decline to the B2 family
marker level (Figure 5-10). A decrease of NMVOC emissions in A1B-AIM after 2060
is explained mainly by the substitution of fossil fuels with renewables, especially
in the transport sector. A very similar trajectory emerges in the A1B-MESSAGE
scenario, while the A1B-ASF scenario emissions grow continuously up to 2100,
by when they are the highest of the set at 550 Mt, almost four times the 1990
level.
5.5.1.3. Carbon Monoxide
|

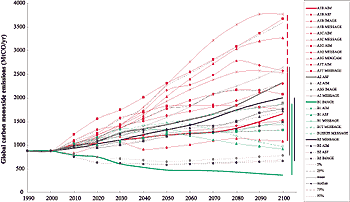
Figure 5-11: Standardized
global emissions of CO for SRES scenarios, classified into four scenario
families (each denoted by a different color code - A1, red; A2, brown;
B1, green; B2, blue). Marker scenarios are shown with thick lines without
ticks, globally harmonized scenarios with thin lines, and non-harmonized
scenarios with thin, dotted lines (see Table 4-3).
Black lines show percentiles, means, and medians for SRES scenarios.
For numbers on the two additional illustrative scenarios A1FI and A1T
see Appendix VII.
|
CO emissions in 1990 are estimated to range between 752 and 984 MtCO across
the models used to derive the SRES scenarios. The same caveats as for NOx and
NMVOC emissions (see above) also apply to CO emissions - the number of models
that represent all the emission source categories is limited and modeling and
data uncertainties, such as emission factors, are considerable. As a result,
CO emission estimates across the scenarios are highly model specific, as indicated
by the overlapping ranges of the four scenario families (Figure 5-11). From
a standardized (see Box 5-1) 1990 level of 880 MtCO
the range of future emissions is rather wide for both medium-term and long-term
time horizons. By 2020, emissions range from 630 to 1550 MtCO, by 2050 they
range between 470 and 2300 MtCO, and by 2100 the range is between 360 and 3760
MtCO (i.e. one order of magnitude difference between the highest and the lowest
projections). Focusing on the 25th and 75th percentile intervals reduces uncertainty
ranges somewhat, but nonetheless they remain substantial - between 1260 and
2300 MtCO by 2100. The median of all 40 scenarios is tracked quite closely by
the B2-ASF scenario at the global level.
Emissions of CO follow rather different trajectories in the SRES markers than
emissions of NMVOCs, except the A2 marker (A2-ASF). Starting from the standardized
(see Box 5-1) level of 880 MtCO in 1990, emissions in the A1B marker (A1B-AIM)
grow continuously and almost double between 1990 and 2100 (Figure 5-11). Emissions
in A1B-MESSAGE (Roehrl and Riahi, 2000) increase at a higher rate than in the
marker and reach thrice the current level by 2100. Emissions in A1B-ASF grow
as fast as in A1B-MESSAGE until 2040 (1700 MtCO versus 1650 MtCO for A1B-MESSAGE),
when the growth stops and emissions more or less stabilize. Emissions in the
B1-IMAGE (B1 family marker) gradually decline to 40% of the current level by
2100 (Figure 5-11). Again, other B1 family scenarios have quite different trajectories
and the patterns generated by AIM, ASF, and MESSAGE models for the B1 scenario
family are similar to those derived by the same models for other storylines.
The shape of the A2 family marker (A2-ASF) trajectory is very similar to that
for NMVOCs, which suggests that these two substances are governed mainly by
the same drivers and that similar assumptions with regard to improved emissions
factors are adopted. The emission trajectory in the B2 marker (B2- MESSAGE)
is just below the A2 marker trajectory and is about 2000 MtCO by 2100, more
than twice the 1990 level. An increase of biomass energy use after 2050 becomes
an important factor that affects emissions in this scenario. Other B2 family
scenarios produced using the AIM and ASF models closely track the B2 marker,
although emissions in these scenarios are somewhat lower, with those of B2-ASF
at 1700 MtCO by 2100 and of B2-AIM falling just below 1500 MtCO.
|