|
2.4.1. Carbon Dioxide Emissions Ranges
The span of CO2 emissions across all scenarios in the database is indeed large,
with a range from more than seven times the current emissions levels to below
current levels in 2100 (see Figures 2-1a and 2-1b).
The possible interpretations of this large range are many. The most important
is the great uncertainty as to how the main driving forces, such as population
growth, economic development, and energy production, conversion and end use,
might unfold during the 21st century. A large majority of the scenarios in the
database report only energy-related CO2 emissions (230 of the 256 that report
CO2 emissions), while only some report non-energy CO2 and other GHG emissions.
Therefore, these comparisons of emissions scenarios focus mostly on energy-related
emissions. Box 2-1 summarizes the set of 26 scenarios that
report land-use CO2 emissions.
| Box 2-1: Range of Land Use CO2 Emissions in the Database |
|
About 23% of the current total anthropogenic CO2 emissions arise from
land-use change (Pepper et al., 1992), which makes it an important
driving force. Direct comparison of absolute levels of land-use CO2 emissions
between scenarios in the database is difficult because of variations in
how models depict deforestation and in how modelers classify anthropogenic
and natural land-use fluxes. In addition, models are based on different
base-year data, which further complicates comparison. For example, the
1990 base-year emissions estimates from land-use change (e.g., deforestation)
range from 0.6 to 1.4 gigatons of elemental carbon (GtC). However, by
indexing emissions to 1990, it is possible to make more meaningful comparisons
of trends among the 26 scenarios in the SRES database that report land-use
CO2 emissions. It is important to note that only three modeling groups
produced the 26 scenarios described here. Clearly, emissions from land-use
change have not been as well explored by the modeling community as energy-related
emissions.
All 26 scenarios show a decrease in CO2 emissions from land-use change
over time and are below current levels by 2100; some models even report
emissions reductions below zero, which suggests CO2 sequestration (e.g.,
through afforestation). The emissions range is very wide during the next
few decades, but narrows considerably around mid-century. For example,
there is more than a factor ten difference (after normalizing for base-year
differences) between the highest and lowest scenarios in 2020. (For reference,
the IS92a scenario falls slightly below the median of the range.) By 2050,
however, the gap between the extremes narrows, and by 2100 the range is
very small indeed: the highest scenario shows CO2 emissions from land
use only 2.4 times as great as those found in the lowest scenario. All
26 scenarios in the database report CO2 emissions of less than 1 GtC originating
from land-use change in 2100, and 23% of the scenarios indicate CO2 sequestration
by the end of the 21st century.
|
|

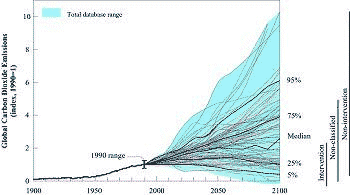
Figure 2-1a: Global energy-related and industrial
CO2 emissions 5
- historical development and future scenarios, shown as an index (1990
= 1). Median (50th), 5th, 25th, 75th, and 95th percentiles of the frequency
distribution are shown. The statistics associated with scenarios from
the literature do not imply probability of occurrence (e.g., the frequency
distribution of the scenarios may be influenced by the use of IS92a
as a reference for many subsequent studies). The vertical bars on the
right side of the figure indicate the ranges for intervention, non-intervention,
and non-classified scenario samples, respectively. The emissions paths
indicate a wide range of future emissions. The range is also large in
the base year 1990 and is indicated by an "error" bar (see also Figure
2-1b). To separate the variation due to base-year specification
from different future paths, emissions are indexed for the year 1990,
when actual global energy-related and industrial CO2
emissions were about 6 GtC. The actual coverage of CO2
emissions sources may vary across the 256 different scenarios from the
database included in the figure. The scenario samples used vary across
the time steps (for 1990 256 scenarios, for 2020 and 2030 247, for 2050
211, and for 2100 190 scenarios). As a result of software limitations,
only 250 scenarios can be plotted on the graph. However, the scenarios
not shown are included in the assessment and have almost identical trajectories
to the sample of 250 scenarios shown. Data sources: Morita and Lee,
1998; Nakicenovic et al., 1998a.
|
|

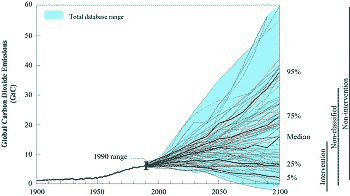
Figure 2-1b: Global energy-related
and industrial CO2 emissions 5 - historical development and future scenarios
(used to derive indexed values in Figure 2-1a),
shown as absolute values in GtC. Median (50th), 5th, 25th, 75th, and
95th percentiles of the frequency distribution are shown. The statistics
associated with scenarios from the literature do not imply probability
of occurrence (e.g., the frequency distribution of the scenarios may
be influenced by the use of IS92a as a reference for many subsequent
studies). The vertical bars on the right side of the figure indicate
the ranges for the intervention, non-intervention, and non-classified
scenario samples, respectively. The emissions paths indicate a wide
range of future emissions. The range is also large in the base year
1990 and is clearly discernable. The actual coverage of CO2 emissions
sources may vary across the 256 scenarios from the database included
in the figure. The scenario samples used vary across the time steps
(for 1990 256 scenarios; for 2020 and 2030 247 scenarios; for 2050 211
scenarios, and for 2100 190 scenarios were analyzed). As a result of
software limitations, only 250 scenarios could be plotted on the graph.
However, the scenarios not shown are included in the assessment and
have almost identical trajectories to the sample of 250 scenarios shown
in the graphic. Data sources: Morita and Lee, 1998; Nakicenovic et
al., 1998a.
|
Figure 2-1a shows the global energy-related and industrial
CO2 emissions pathways from the database in the form of spaghetti curves for
the period 1990 to 2100 against the background of historical emissions from
1900 to 1990. These curves are plotted against an index on the vertical axis
rather than as absolute values, because of large differences and discrepancies
for the values assumed for the base year 1990 in various scenarios. The discrepancies
may result from genuine differences among the scenarios (e.g., different base
years, data sources, and definitions 4
) or from simple errors in calibration.
Figure 2-1b gives absolute values of CO2 emissions
from various scenarios in the database. It shows the magnitude of differences
between the scenarios in the base year 1990 and gives the resultant range of
emissions in 2100 directly in GtC.6
Between 1900 and 1990, global CO2 emissions have increased at an average rate
of about 1.7% per year (Nakic´enovic´ et al., 1998b). Global emissions
would double during the next three to four decades if this historical trend
were to continue. Many scenarios in the database describe such a development.
However, even by 2030 the range is very large around this value of possible
doubling of global emissions. The highest scenarios have emissions four times
the 1990 level by 2030, while the lowest are barely above half that level. The
divergence increases with time so that the highest scenarios envisage a tenfold
increase of global emissions by 2100. The lowest scenarios continue to decrease
and some of them are consistent with emissions trajectories that lead to an
eventual stabilization of atmospheric GHG concentrations.
Figure 2-1a indicates a large range between the
highest and the lowest scenarios. Some of the scenarios on both extremes can
be characterized as clear outliers in the far tails of the scenario distribution.
Often, such scenarios are normative in nature, having been formulated for a
particular purpose. However, even if these extreme tails are discarded the range
is very wide. The 95th percentile corresponds to a sixfold increase (about 37
GtC) by 2100, while the 5th percentile leads to a decrease to about a third
(2 GtC) compared to the 1990 level. This range of 2-37 GtC in 2100 indicates
the high degree of uncertainty with respect to the level of future GHG emissions.
The emissions range is somewhat smaller, from 6.5 to 22 GtC, for the 25th and
75th percentiles, respectively. However, the statistics associated with scenarios
from the literature do not imply probability of their occurrence.
|