|
2.4.7. Population and Gross World Product Relationships
|

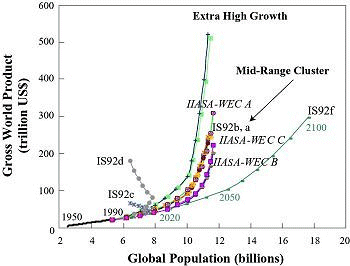
Figure 2-7: Gross world product
and population growth, historical development, 1950 to 1990, and scenarios
in the database to 2100, in trillion US dollars and billion people.
All endpoints of the curves correspond to 2100.
|
The scenarios in the database portray a weak relationship between population
and economic growth; the correlation is slightly negative. Scenarios that lead
to a very high gross world product are generally associated with central to
low population projections, while high population projections do not lead to
the highest gross world product scenarios. At extremely high levels of average
global income the correlation is strongly negative. The highest per capita incomes
in 2100 - in the range between US$30,000 and US$45,000 - are achieved with a
low-to- medium population growth.
Figure 2-7 illustrates some of the relationships between
population and gross world product in the scenarios. It compares only 39 scenarios
as information about population and gross world product assumptions is available
for only a few scenarios. In most of these, global population transition is
achieved during the 21 st century and stabilization occurs at a population between
10 to 12 billion people in the year 2100. Generally, this is associated with
relatively high levels of economic development, in the range US$200-500 trillion
in the year 2100. Scenarios at the lower end of this scale are labeled collectively
as the "mid-range cluster," which includes all IIASA-WEC scenarios (IIASA-WEC,
1995; Nakicenovic et al., 1998b), IS92a and b (Pepper et al., 1992),
and AIM96 (Matsuoka et al., 1994). The two highest scenarios are labeled
as the "extra high growth" cases, namely IS92e (Pepper et al., 1992)
and IMAGE 2.1, Baseline-C (Alcamo and Kreileman, 1996).
One scenario, IS92f, shows high population growth (over 18 billion people by
2100) with comparatively low economic growth (about the same level as the mid-range
cluster of scenarios, approximately US$300 trillion). At the other side of the
scale are the two IS92 variants (c and d (Pepper et al., 1992)) with
low population projections (about 6 billion people by 2100).
2.4.8. Primary Energy Consumption Ranges
|

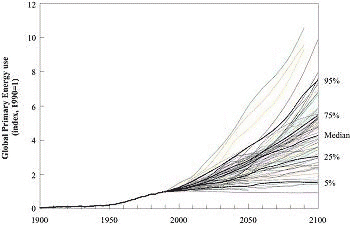
Figure 2-8: Global primary
energy consumption - historical development and in future scenarios,
shown as an index (1990 = 1). Data sources: Morita and Lee, 1998; Nakicenovic
et al., 1998a.
|
Primary energy consumption is another fundamental determinant of GHG emissions.
Clearly, high energy consumption leads to high emissions. However, what is more
important for emissions is the structure of future energy systems. High carbon
intensities of energy - namely high shares of fossil energy sources, especially
coal, in total energy consumption - lead to scenarios with the highest CO2 emissions.
The primary energy paths of different scenarios are compared here, and the issue
of energy carbon intensity is considered in the next section.
Figure 2-8 shows the primary energy consumption paths
in the scenarios and its historical development since 1900. It gives the whole
distribution of the 153 scenarios in the SRES database that report primary energy
consumption, the median, and the 95th, 75th, 25th and 5th percentiles. As a
result of the relatively large differences in the base-year values, the primary
energy consumption paths are plotted as an index and spliced to the historical
data in 1990. In 1990, primary energy was about 370 EJ, including non-commercial
energy (Nakicenovic et al., 1996).
On average the global primary energy consumption has increased at more than
2% per year (fossil energy alone has risen at almost 3% per year) since 1900.
Also, the short-term trend from 1975 to 1995 shows a similar increase. In the
scenarios the average growth rates to 2100 range from 2.4% per year to -0.1%
per year, with a median value of 1.3% per year.
For the full range of scenarios, the factor increase above the 1990 level is
0.9 to 10 by 2100. 10
However, Figure 2-8 indicates that this full range includes a few noticeable
outliers, especially toward the high end of energy consumption levels. The rest
of the scenarios are grouped more closely together, which compresses the range
to a factor increase of about 1.5 to 7.5 times the 1990 level. The degree of
clustering is discussed in greater detail below.
|