|

Figure 3-2: Most recent world
population projections from the four main demographic organizations,
including high and low variants. Two of the projections (USCB and World
Bank) will not be published. Variations in future world populations
are largely determined by different assumptions concerning the demographic
transition in developing countries as well as long-range fertility rates
worldwide.
|

Figure 3-3: Central projections
extracted from Figure 3-2 show excellent agreement
among the central projections over the next 100 years (with the possible
exception of the IIASA projection).
|

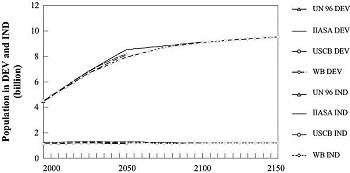
Figure 3-4: Industrial (IND)
and developing (DEV) countries' population projections from the medium
(central) variants. Note that regional definitions differ in IIASA compared
to UN projections.
|

Figure 3-5: Projected world
average TFRs from the UN, IIASA, and World Bank. The older 1994 World
Bank projections are shown, because the latest (1996) projection methodology
is not published. USCB fertility rates are not readily available and
so are omitted. UN fertility assumptions are shown only for the 1996
Revision as full detail of the 1998 data were unavailable at the time
of drafting this report.
|
3.2.3.2. Currently Available Population Projections
World population projections are currently generated by the following institutions:
- United States Census Bureau (USCB);
- World Bank;
- UN; and
- IIASA.
The main defining characteristics of the individual projections and a detailed
description of each projection is given in Gaffin (1998).
Figure 3-2 displays these latest world population numbers
from all four demographic organizations. Two of the four projections, from the
World Bank and USCB, contain only one central estimate and are unpublished.
These are generated currently for internal organizational purposes and are not
further considered here.
The only population projections that currently incorporate variation of the
long-range fertility rates are those produced by UN and IIASA (Gaffin, 1998).
For the UN, these variants result in four additional projections to the UN medium
projection and are referred to as "low,""medium low," "medium high" and "high."
The designations reflect the average world fertility rate relative to the medium
projection. For IIASA, the primary variants also refer to world average fertility
(and mortality) rate relative to the medium projection and are referred to in
Figure 3-2 as "high" and "low."
The central projections in Figure 3-3 show excellent agreement
over the next 100 years, with the exception of the "overshoot" in the IIASA
projection, discussed below. Although significant, such an agreement does not
imply certainty or accuracy. Rather, it reflects the use of similar methodologies
and databases, the dominance of population momentum associated with a young
population age structure, and the assumption of replacement-level fertility
in the long term.
Figure 3-4 shows the breakdown of population growth
projections in industrial countries (IND) and developing countries (DEV) as
defined by the UN. The key conclusion to draw from Figure 3-4 is the dominance
of the DEV population on future world population growth.
The most important variable to determine future population levels is fertility.
To a lesser extent, future population also depends on mortality and migration
rates. Figure 3-5 shows the world-average total
fertility rate (TFR), the average number of births per woman, assumed for the
various projections. Overall, a fairly broad range of assumptions about future
world average fertility is encompassed by the projections. Future population
size is very sensitive (see Figure 3-2) to comparatively
small changes in the long-range fertility rate. For example, within the UN projections,
a decrease of the asymptotic fertility rate of less than half-a-birth per woman
(from 2.1 to 1.7) decreases population in 2100 by 46% (UN, 1998). Only the replacement-level
fertility of about 2.1 results in a stable population in the long run.
Such sensitivity to small asymptotic fertility-rate changes indicates the high
and low projections from UN and IIASA are all feasible scenarios of the future
population (Gaffin and O'Neill, 1998).
Up to 2050, the IIASA central TFR is high compared with the UN and World Bank
central projection. Later the IIASA central TFR declines to below replacement-level
fertility rate, as depicted in Figure 3-5. As a result,
the IIASA central forecast lies considerably above all the others throughout
the 21st century. After that, IIASA's below-replacement, long-term fertility
assumption causes the projection to decline and to "hit" the World Bank and
UN curves in 2100. This "overshoot" occurs because the IIASA central scenario
assumptions rely on an expert poll conducted in 1993 (Lutz, 1994), whereas other
projections incorporate more recent information into their future assumptions
(more rapid recent fertility declines in many developing countries; see Courbage,
1998). However, among demographers disagreement persists on the timing and rates
of demographic transition in the developing countries, in particular between
the demographers at IIASA and those at the UN and World Bank (see the discussion
in Lutz, 1994) on the differences among alternative population projections).
This disagreement reflects important uncertainties in the projection of future
demographic developments. The below-replacement, long-term fertility level in
the IIASA central estimate is a hallmark of the institute's work. Demographers
at IIASA strongly adhere to the view that there is little reason to expect developed
nations to return to replacement-level fertility, while much evidence suggests
that low long-term rates will persist (Lutz et al., 1996). One issue
here, however, is that the TFR measure is currently depressed in Europe, in
part because women are delaying their childbearing until later ages (Bongaarts,
1998). Thus, the TFR may rise if these women do have children, and such a correction
has to be incorporated into the long-term TFR assumptions (e.g., see Courbage,
1998). Important uncertainties are by how fast and how much the TFR will rise.
|