|
3.2.5. Relationships
3.2.5.1. Introduction
Within the caveats in Section 3.1, a number of demographic
studies show that population change does exert a strong first-order scaling
effect on CO2 emissions models (O'Neill, 1996; Gaffin and O'Neill, 1997; O'Neill
et al., 2000; Wexler, 1996). These studies support the notion that population
growth and the policies that affect it are key factors for future emissions.
Balanced against this, however, are other studies that take a more skeptical
view (Kolsrud and Torrey, 1992; Birdsall, 1994; Preston, 1996). A full review
of model results that address this question is given in O'Neill (1996) and Gaffin
and O'Neill (1997) and is not be reproduced here because of space limitations
(for a review see Gaffin, 1998). In essence, the controversy is one of the relationships
between population growth and economic development, as well as other salient
factors that influence emissions. These relationships were first discussed within
the context of IPCC emissions scenarios by Alcamo et al. (1995) and are discussed
in more detail in the following sections.
3.2.5.2. The Effect of Economic Growth on Population Growth
|

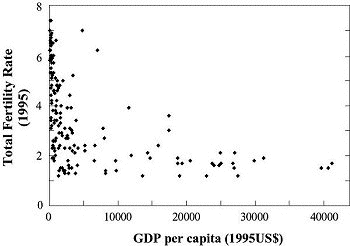
Figure 3-7: TFRs in 1995 versus
GDP per capita in US dollars at 1995 prices for most of the world's
countries. Data source: World Bank, 1997b.
|
Figure 3-7 shows the long-established negative correlation
between fertility rates and per capita income. Clearly, richer countries uniformly
have a relatively low fertility rate. Poorer countries, on average, have a higher
fertility rate. Lower fertility, however, does exist in some poor countries
or regions, which illustrates the importance of social and institutional structures.
Barro (1997) reports a statistically significant correlation between per capita
GDP growth and the variables life expectancy and fertility in his analysis of
post-1960 growth performance of 100 countries. Other things being equal, growth
rates correlate positively (higher) with increasing life expectancy and negatively
(lower) with high fertility, which confirms the view that the affluent live
longer and have fewer children.
Figure 3-7, a snapshot of many countries passing through
the "demographic fertility transition" can be explained from both economic and
socio-demographic points of view (Easterlin, 1978). Economically, Figure
3-7 can be interpreted as a reflection of the substitution that families
make - away from having children and toward consuming more goods and services.
With greater wealth, both goods and services become increasingly available as
part of the families' "basket of choices" for consumption and, accordingly,
they shift away from higher fertility to lower fertility. This move is further
prompted by the rising relative costs of childcare, which include preferences
that increase a child's quality of life, such as better schooling and extracurricular
activities.
This income effect is primarily interpreted with respect to fertility changes
in currently developing countries. In currently industrial countries, any change
of fertility in response to increasing wealth is likely to be different from
and probably even opposite to that of developing countries' fertility. Indeed,
there is evidence of this in Eastern Europe, Sweden, Russia, and (recently)
the United States (UN, 1997a), and it is linked to the question of long-term
fertility rates in industrial countries (see Section
3.2.3.2.). However, it is evident that future world population levels will
be dominated by growth in developing countries. Thus, if it is accepted that
fertility is lower with greater affluence, then in emissions scenarios lower
populations will still tend to correlate with higher per capita incomes.
Another countervailing factor is that mortality rates should also decline with
wealth; as an isolated effect, this obviously results in higher population levels.
However, the combined impact of both fertility and mortality reduction on population
size is a net reduction in population levels (Lutz, 1996).
From a demographic point of view, the primary effect seen in Figure
3-7 is interpreted as infant and child mortality decline with increasing
affluence. Families, in a sense, have to use birth control to achieve their
desired number, which has always been lower than fertility rates. Increased
affluence results in increased knowledge of, access to, and use of birth control,
and accordingly families shift their reproductive behavior to lower fertility
rates. Accompanying this basic premise is a host of complex social changes,
including increased opportunities for education, employment, and non-maternal
roles for women. Incorporation of the inverse relationship between economic
and population growth in long-term emission scenarios is recent and mostly carried
out in a qualitative way. Alcamo et al. (1995) reviews the literature available
up to 1994. Nakicenovic et al. (1998a) report a long-term scenario
study in which timing and extent of economic catch-up in developing countries
were found to be tied to timing and pace of their demographic transition. Patterns
of the range of per capita GDP growth rates for developing countries available
in the literature (and given in Figure 3-10) also
appear to reflect this relationship. Growth trends for the period 2020-2050
are generally higher than those for earlier or later periods; it is in this
period that, according to demographic projections, the fastest change in demographic
variables (especially fertility) will take place.
|