|
3.2.6. Conclusions
From the available population projections, only those from the UN and IIASA
fulfill the characteristics needed for use in long-term emission scenarios.
First, the UN and IIASA data are published and available in the public domain,
and second (more importantly) the scenarios consider uncertainty by developing
more than just one, central demographic projection.
We use the medium UN projections in the SRES emissions scenarios because they
have greater recognition internationally, and garner considerable attention
as evident from the press focus devoted to the 1996 Revision (mentioned above).
In addition, the UN assumption of replacement-level fertility in the long term,
in contrast to the IIASA below-replacement assumption, is an important normative
approach widely used heretofore in projections.
The rapid and slow demographic transition variants from IIASA projections remain
attractive as the "high" and "low" population variants to be considered for
the new IPCC emissions scenarios. The incorporation of a correlation between
mortality rates and fertility (Lutz, 1996) is a logical first-order relationship
not used in previous population variants and, in particular, not a feature of
the UN variants. The two IIASA variants also represent well the uncertainty
range as spanned by the probabilistic projections of Lutz et al. (1997), which
represent an important methodological advance in the field. As shown in Figure
3-2, the resultant IIASA population range falls within the range of the
UN projections.
|
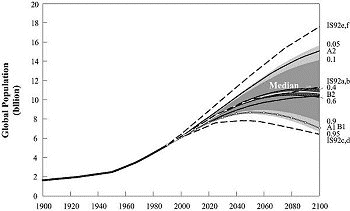
Figure 3-8: Comparison of the
IS92 population range (dashed lines) with the population range adopted
for SRES (solid lines), which uses the two IIASA variants (low, high)
and the UN 1998 Long Range medium projection. The correspondence to
the four SRES scenario families (A1, A2, B1 and B2) is also shown. Generally,
the new range is narrower and has significantly lower medium and high
variant population levels, reflecting recent advances in demographic
projections. Also for comparison, the probabilistic range of world population
projections given by Lutz et al. (1997) is shown.
|
Based on the above recommendations, Figure 3-8 compares
the older IS92 population range with the population range described in this
section. The population projections in IS92 scenarios comprise the UN 1992 medium-high
and medium-low variants for the high and low ranges with the World Bank 1991
projection as the central case. As seen in Figure 3-8,
the new range for SRES is somewhat narrower and lower than the IS92 range. The
cause is partly the positive correlation between mortality rates and fertility
rates within the IIASA variants, which mildly offset each other in terms of
future population size. Another reason is the recent downward revision of the
UN medium projection compared to earlier UN scenarios (as outlined above).
The literature suggests a general inverse correlation between economic growth
rates and population growth rates. Higher economic growth rates in developing
countries should correlate with lower population growth rates in long-term scenarios
and vice versa, because of the importance of economic development in bringing
about the demographic fertility transition. This represents a distinctive change
from the IS92 trajectories. Importantly, there is still no quantitative basis
for associating any particular economic growth curve with a particular population
curve; this is a qualitative negative correlation only. Even more important
is that income is not necessarily the best predictor of future fertility rates
and many countries are currently moving through the demographic transition without
a clear economic cause. Alternatively, some countries have failed to begin a
fertility decline even though economic and social conditions have improved (e.g.,
Sathar and Casterline, 1998).
The inclusion of a household demographic unit, in addition to population, should
be encouraged in future studies. The effect is linked to a strongly predicted
demographic trend - aging. Also important are that smaller households are more
energy intensive, per person, and that aging may continue to increase more rapidly
than population in the future. These factors may increase CO2 emissions (MacKellar
et al., 1995), although senior citizens group-living is a tendency in
some industrialized countries. Urbanization might also have a strong effect
on emissions because of its effect on income distribution and thus energy consumption
patterns around the world, although many of these effects are included implicitly
in the models and parameters used in this report.
|