|
3.5.2. Carbon Dioxide Emissions from Anthropogenic Land-Use Change
A variety of changes in land use can result in anthropogenic CO2 emission or
absorption. These changes most obviously include permanent deforestation or
afforestation. However, many changes in land-management practices also contribute
to CO2 fluxes because of changes in standing biomass densities or in soil carbon.
Empirical studies of such CO2 fluxes are rare, so that information on current
emissions is very poor. Whereas comprehensive information exists for forests
globally, only a few countries have detailed information on forest and agricultural
land-management practices. Hence, global estimates of CO2 emissions from anthropogenic
land-use change, including those in the SRES, tend to be based entirely on net
deforestation-afforestation and on average figures for carbon storage per hectare
in forests.
|

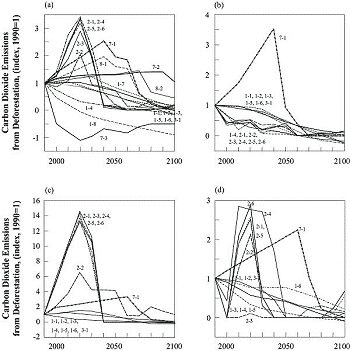
Figure 3-14: Emissions of
carbon dioxide from deforestation: (a) global, (b) Asia, (c) Africa,
(d) Latin America. Scenarios numbers are given in Table
3-7.
|
Emissions of CO2 from deforestation arise mostly from the burning of trees
and other vegetation in tropical forests cleared for agricultural use. These
emissions also stem from the decomposition of trees harvested for lumber, the
burning of wood for fuel, and soil respiration. If harvested wood is replaced
by new seedlings, it is normally assumed that the amount of CO2 released by
decomposition or burning is compensated by the CO2 taken up during growth of
the seedlings and, therefore, that the net emissions of harvested trees is zero.
Where net afforestation occurs, net emissions are taken to be negative (i.e.
afforestation acts as a sink).
As a consequence of inconsistencies in base-year estimates for net changes
in forest biomass, emission estimates are normalized relative to their 1990
value before comparison with each other (Figure 3-14).
Figure 3-14 also clearly depicts the relative change of
emissions with time (Alcamo, et al., 1995; Nakicenovic et al.,
1998b).
The scenarios of CO2 emissions from land-use change have quite different temporal
paths, and show their widest range before the middle of the 21st century (Figure
3-14). Nearly all the scenarios then converge to very low emissions by the
end of the century. At their widest point, the scenarios span about a factor
of 14.
The different sets of scenarios can be grouped into roughly two typical paths:
One set declines smoothly after 1990, while the other sharply increases for
a few decades after 1990. After the middle of the 21st century most scenarios
stabilize or continue to decline because either the driving forces of deforestation
equilibrate or because forests are depleted. These processes are discussed further
below. By 2100, CO2 scenarios of deforestation range from zero to 30% of their
base-year estimates.
As emissions from deforestation are more significant in developing regions
than industrial regions, few scenarios of CO2 from deforestation are available
for industrial regions, so the focus here is on developing regions only. For
Asia, emissions in all but one scenario (EPA-SCW, 7-1 in Table
3-7) steadily decline after the base year, and reach 25% or less of their
1990 value in 2100 (Figure 3-14b). For Africa, emissions
first increase before eventually decreasing in 2100 to a small fraction of their
1990 value (Figure 3-14c). In this scenario, deforestation
rates decline in Asia and Africa because of the depletion of their forests.
For Latin America, the wide range of scenarios reflects the wide range of views
about its future rates of deforestation (Figure 3-14d).
|

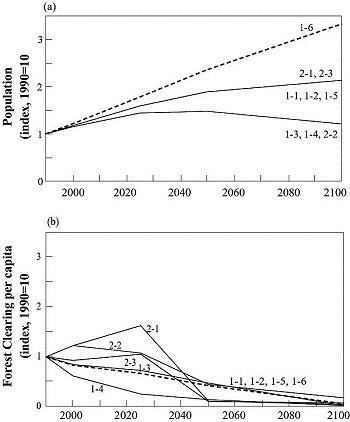
Figure 3-15: Selected driving
forces of deforestation: (a) Population assumptions, and (b) Forest
clearing rate per unit population. Both are normalized. Scenarios numbers
are given in Table 3-7.
|
One of the main factors that affects estimates of CO2 from deforestation is
the assumed deforestation rate, which is estimated by a wide variety of methods.
For example, the IS92a-IS92f scenarios assume that deforested area is proportional
to population, with a time lag of 25 years, and that deforestation continues
until 25 years after the population stabilizes or until forests are exhausted
(Leggett et al., 1992). The IMAGE 2.1 emission estimates are based on
computed changes in global land cover, which take into account changing demand
for agricultural commodities. Trexler and Haugen (1995) compute the rate of
tropical deforestation on a country-by- country basis, and include information
from questionnaires. Jepma (1995) uses a combination of three models (a socio-economic
model, a wood demand-supply model, and a land-use model), while Palo et al.
(1997) correlate deforestation rates with income levels. To further confound
this situation, the factors that affect deforestation vary greatly from place
to place, and therefore need to be defined as locally as possible.
Figure 3-15 presents population assumptions of
various deforestation scenarios, together with the assumed or implied deforestation
rates on a per capita basis. The shape of the emission curves (Fig.
3-14) follows the shape of the deforestation rate curves, rather than that
of the population assumptions. However, the range of emissions is much larger
than the range of deforestation rates. Some conclusions can be drawn from these
data:
- When given on a per capita basis, the range of deforestation rates is perhaps
not as great as expected (about a factor of eight) considering the wide range
of assumptions and methods used to estimate these rates.
- The temporal trend of emissions arises from the temporal trend of deforestation
estimates.
- The range of emissions is strongly, but not only, influenced by the deforestation
rates, and at its widest (a factor 14) can be better explained by the combined
range of per capita deforestation rates, population, and carbon density.
The role that assumed carbon density of vegetation plays in the estimation
of CO2 emissions must be considered. To estimate CO2 emissions, it is necessary
to estimate the carbon density of vegetation that is burned and decayed when
forests are cleared. However, there is wide disagreement in the literature as
to typical values of carbon density because of both the many methods used to
measure density and the wide variation in the mix of tropical forest vegetation.
|