 |
| Question 2
What is the evidence for, causes of, and consequences
of changes in the Earth's climate since the pre-industrial era?
- Has the Earth's climate changed since the pre-industrial
era at the regional and/or global scale? If so, what part, if any, of
the observed changes can be attributed to human influence and what part,
if any, can be attributed to natural phenomena? What is the basis for
that attribution?
- What is known about the environmental, social, and
economic consequences of climate changes since the pre-industrial era
with an emphasis on the last 50 years?
|
 |
|
| |
|
| The Earth's climate system has demonstrably
changed on both global and regional scales since the pre-industrial era,
with some of these changes attributable to human activities. |
 Q2.2
Q2.2
|
| |
|
| Human activities have increased the atmospheric
concentrations of greenhouse gases and aerosols since the pre-industrial
era. The atmospheric concentrations of key anthropogenic greenhouse
gases (i.e., carbon dioxide (CO2), methane (CH4),
nitrous oxide (N2O), and tropospheric ozone (O3))
reached their highest recorded levels in the 1990s, primarily due to the
combustion of fossil fuels, agriculture, and land-use changes (see Table
SPM-1). The radiative forcing from anthropogenic greenhouse gases
is positive with a small uncertainty range; that from the direct aerosol
effects is negative and smaller; whereas the negative forcing from the
indirect effects of aerosols on clouds might be large but is not well
quantified.
|
Q2.4-5
|
| An increasing body of observations gives a collective picture
of a warming world and other changes in the climate system (see Table
SPM-1). |
Q2.6 |
| |
|
| Globally it is very likely that the 1990s was the
warmest decade, and 1998 the warmest year, in the instrumental record (1861-2000)
(see Box SPM-1). The
increase in surface temperature over the 20th century for the Northern Hemisphere
is likely to have been greater than that for any other century in the last
thousand years (see Table SPM-1).
Insufficient data are available prior to the year 1860 in the Southern Hemisphere
to compare the recent warming with changes over the last 1,000 years. Temperature
changes have not been uniform globally but have varied over regions and
different parts of the lower atmosphere. |
Q2.7 |
| |
|
| Table SPM-1:
20th century changes in the Earth's atmosphere, climate, and
biophysical system.a |
| Indicator |
Observed Changes |
| Concentration
indicators |
|
| Atmospheric concentration of CO2 |
280 ppm for the period 1000-1750 to 368 ppm in year
2000 (31±4% increase). |
| Terrestrial biospheric CO2 exchange |
Cumulative source of about 30 Gt C between the years
1800 and 2000; but during the 1990s, a net sink of about 14±7
Gt C. |
| Atmospheric concentration of CH4 |
700 ppb for the period 1000-1750 to 1,750 ppb in year
2000 (151±25% increase). |
| Atmospheric concentration of N2O |
270 ppb for the period 1000-1750 to 316 ppb in year
2000 (17±5% increase). |
| Tropospheric concentration of O3 |
Increased by 35±15% from the years 1750 to
2000, varies with region. |
| Stratospheric concentration of O3 |
Decreased over the years 1970 to 2000, varies with
altitude and latitude. |
| Atmospheric concentrations of HFCs, PFCs, and SF6 |
Increased globally over the last 50 years. |
| Weather indicators |
|
| Global mean surface temperature |
Increased by 0.6±0.2°C over the 20th century;
land areas warmed more than the oceans (very likely). |
Northern Hemisphere surface
temperature |
Increased over the 20th century greater than during
any other century in the last 1,000 years; 1990s warmest decade of
the millennium (likely). |
| Diurnal surface temperature range |
Decreased over the years 1950 to 2000 over land: nighttime
minimum temperatures increased at twice the rate of daytime maximum
temperatures (likely). |
| Hot days / heat index |
Increased (likely). |
| Cold / frost days |
Decreased for nearly all land areas during the 20th
century (very likely). |
| Continental precipitation |
Increased by 5-10% over the 20th century in the Northern
Hemisphere (very likely), although decreased in some regions
(e.g., north and west Africa and parts of the Mediterranean). |
| Heavy precipitation events |
Increased at mid- and high northern latitudes (likely). |
| Frequency and severity of drought |
Increased summer drying and associated incidence of
drought in a few areas (likely). In some regions, such as
parts of Asia and Africa, the frequency and intensity of droughts
have been observed to increase in recent decades. |
| Biological and physical
indicators |
|
| Global mean sea level |
Increased at an average annual rate of 1 to 2 mm during
the 20th century. |
| Duration of ice cover of rivers and lakes |
Decreased by about 2 weeks over the 20th century in
mid- and high latitudes of the Northern Hemisphere (very likely). |
| Arctic sea-ice extent and thickness |
Thinned by 40% in recent decades in late summer to
early autumn (likely) and decreased in extent by 10-15% since
the 1950s in spring and summer. |
| Non-polar glaciers |
Widespread retreat during the 20th century. |
| Snow cover |
Decreased in area by 10% since global observations
became available from satellites in the 1960s (very likely). |
| Permafrost |
Thawed, warmed, and degraded in parts of the polar,
sub-polar, and mountainous regions. |
| El Niño events |
Became more frequent, persistent, and intense during
the last 20 to 30 years compared to the previous 100 years. |
| Growing season |
Lengthened by about 1 to 4 days per decade during
the last 40 years in the Northern Hemisphere, especially at higher
latitudes. |
| Plant and animal ranges |
Shifted poleward and up in elevation for plants, insects,
birds, and fish. |
| Breeding, flowering, and migration |
Earlier plant flowering, earlier bird arrival, earlier
dates of breeding season, and earlier emergence of insects in the
Northern Hemisphere. |
| Coral reef bleaching |
Increased frequency, especially during El Niño
events. |
| Economic indicators |
|
| Weather-related economic losses |
Global inflation-adjusted losses rose an order of
magnitude over the last 40 years (see Q2 Figure
2-7). Part of the observed upward trend is linked to socio-economic
factors and part is linked to climatic factors. |
| a. This table provides
examples of key observed changes and is not an exhaustive list. It
includes both changes attributable to anthropogenic climate change
and those that may be caused by natural variations or anthropogenic
climate change. Confidence levels are reported where they are explicitly
assessed by the relevant Working Group. An identical table in the
Synthesis Report contains cross-references to the WGI and WGII reports. |
| Box SPM-1: Confidence and likelihood
statements. |
| Where appropriate, the authors of
the Third Assessment Report assigned confidence levels that represent
their collective judgment in the validity of a conclusion based
on observational evidence, modeling results, and theory that they
have examined. The following words have been used throughout the
text of the Synthesis Report to the TAR relating to WGI findings:
virtually certain (greater than 99% chance that a result
is true); very likely (90-99% chance); likely
(66-90% chance); medium likelihood (33-66% chance);
unlikely (10-33% chance); very unlikely (1-10%
chance); and exceptionally unlikely (less than 1% chance).
An explicit uncertainty range (±) is a likely range.
Estimates of confidence relating to WGII findings are: very
high (95% or greater), high (67-95%), medium
(33-67%), low (5-33%), and very low
(5% or less). No confidence levels were assigned in WGIII. |
|
|
| |
|
| There is new and stronger evidence that most of the
warming observed over the last 50 years is attributable to human activities.
Detection and attribution studies consistently find evidence for an anthropogenic
signal in the climate record of the last 35 to 50 years. These studies include
uncertainties in forcing due to anthropogenic sulfate aerosols and natural
factors (volcanoes and solar irradiance), but do not account for the effects
of other types of anthropogenic aerosols and land-use changes. The sulfate
and natural forcings are negative over this period and cannot explain the
warming; whereas most of these studies find that, over the last 50 years,
the estimated rate and magnitude of warming due to increasing greenhouse
gases alone are comparable with, or larger than, the observed warming. The
best agreement between model simulations and observations over the last
140 years has been found when all the above anthropogenic and natural forcing
factors are combined, as shown in Figure
SPM-2. |
Q2.9-11 |
| |
|
| Changes in sea level, snow cover, ice extent, and
precipitation are consistent with a warming climate near the Earth's
surface. Examples of these include a more active hydrological cycle
with more heavy precipitation events and shifts in precipitation, widespread
retreat of non-polar glaciers, increases in sea level and ocean-heat content,
and decreases in snow cover and sea-ice extent and thickness (see Table
SPM-1). For instance, it is very likely that the 20th century warming
has contributed significantly to the observed sea-level rise, through thermal
expansion of seawater and widespread loss of land ice. Within present uncertainties,
observations and models are both consistent with a lack of significant acceleration
of sea-level rise during the 20th century. There are no demonstrated changes
in overall Antarctic sea-ice extent from the years 1978 to 2000. In addition,
there are conflicting analyses and insufficient data to assess changes in
intensities of tropical and extra-tropical cyclones and severe local storm
activity in the mid-latitudes. Some of the observed changes are regional
and some may be due to internal climate variations, natural forcings, or
regional human activities rather than attributed solely to global human
influence. |
Q2.12-19 |
| |
|
| Observed changes in regional climate
have affected many physical and biological systems, and there are preliminary
indications that social and economic systems have been affected.
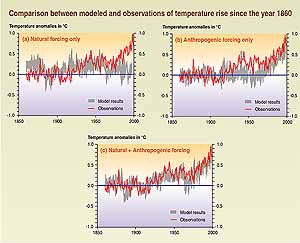 Figure
SPM-2: Simulating the Earth's temperature variations (°C)
and comparing the results to the measured changes can provide insight
to the underlying causes of the major changes. A climate
model can be used to simulate the temperature changes that occur from
both natural and anthropogenic causes. The simulations represented
by the band in (a) were done with only natural forcings: solar variation
and volcanic activity. Those encompassed by the band in (b) were done
with anthropogenic forcings: greenhouse gases and an estimate of sulfate
aerosols. And those encompassed by the band in (c) were done with
both natural and anthropogenic forcings included. From (b), it can
be seen that the inclusion of anthropogenic forcings provides a plausible
explanation for a substantial part of the observed temperature changes
over the past century, but the best match with observations is obtained
in (c) when both natural and anthropogenic factors are included. These
results show that the forcings included are sufficient to explain
the observed changes, but do not exclude the possibility that other
forcings may also have contributed. Figure
SPM-2: Simulating the Earth's temperature variations (°C)
and comparing the results to the measured changes can provide insight
to the underlying causes of the major changes. A climate
model can be used to simulate the temperature changes that occur from
both natural and anthropogenic causes. The simulations represented
by the band in (a) were done with only natural forcings: solar variation
and volcanic activity. Those encompassed by the band in (b) were done
with anthropogenic forcings: greenhouse gases and an estimate of sulfate
aerosols. And those encompassed by the band in (c) were done with
both natural and anthropogenic forcings included. From (b), it can
be seen that the inclusion of anthropogenic forcings provides a plausible
explanation for a substantial part of the observed temperature changes
over the past century, but the best match with observations is obtained
in (c) when both natural and anthropogenic factors are included. These
results show that the forcings included are sufficient to explain
the observed changes, but do not exclude the possibility that other
forcings may also have contributed. |
|
Q2.20
& Q2.25 |
|
Q2 Figure 2-4 |
| |
|
| Recent regional changes in climate, particularly increases
in temperature, have already affected hydrological systems and terrestrial
and marine ecosystems in many parts of the world (see Table
SPM-1). The observed changes
in these systems1
are coherent across diverse localities and/or regions and are consistent
in direction with the expected effects of regional changes in temperature.
The probability that the observed changes in the expected direction (with
no reference to magnitude) could occur by chance alone is negligible. |
Q2.21-24 |
| |
|
| The rising socio-economic costs related to weather
damage and to regional variations in climate suggest increasing vulnerability
to climate change. Preliminary indications suggest that some social
and economic systems have been affected by recent increases in floods and
droughts, with increases in economic losses for catastrophic weather events.
However, because these systems are also affected by changes in socio-economic
factors such as demographic shifts and land-use changes, quantifying the
relative impact of climate change (either anthropogenic or natural) and
socio-economic factors is difficult. |
Q2.25-26 |
|
|
